Hi all. I’m really new to templating. How do you correctly debug blade? All I get is a reference to the compiled file. What is your workflow for this? I’ve been looking through the best practice thread but still cant wrap my head around how to debug.
3 Likes
I just ran into this issue as well. Digging into it a little more now, if I figure something out I’ll post it back, otherwise if anyone has some advice on this it would be greatly appreciated.
1 Like
Use whoops…
There is a WordPress implementation here. Just make sure you don’t accidentally leave WP_DEBUG enabled on a live site, it dumps your environmental variables on the debug screen thus dumping your database credentials.
Otherwise, it should easily solve the headache of debugging.
2 Likes
Are you using wps? I get a fatal error on activation.
You need to composer install in its directory if you didn’t use composer create-project
1 Like
Gotcha. Will give it a whirl later!
You can also use it as a theme dependency other than a wp-plugin
1 Like
Hmm…
WPS may need some quality of life updates. It appears to be breaking my AJAX in the backend.
This might be helpful - https://stackoverflow.com/questions/28501077/phpstorm-unable-to-set-breakpoints-in-blade-php-files
FWIW, the link above is working for me. Dropping @php(xdebug_break) into a Blade template kicks off the debugger for me.
It’s a little weird because you end up stepping through the compiled PHP file, but all the variables are accessible. Regardless it seems like most of the debug action is probably going to take place in the controller anyway.
I installed Whoops directly as a require-dev in composer.json.
"require-dev": {
    ...
    "filp/whoops": "^2.1",
    ...
},
Then registered it in my setup.php file.
function registerWhoops() {
    $whoops = new \Whoops\Run;
    $whoops->pushHandler(new \Whoops\Handler\PrettyPageHandler);
    $whoops->register();
}
if( WP_DEBUG ) registerWhoops();
2 Likes
Maybe someone can help me. I use PhpStorm as my IDE.
This is my setup:
function registerWhoops() {
    $whoops  = new \Whoops\Run;
    $handler = new \Whoops\Handler\PrettyPageHandler;

    $handler->setEditor( 'phpstorm' );
    $whoops->pushHandler( $handler );
    $whoops->register();
}
Resource: whoops/Open Files In An Editor.md at master · filp/whoops · GitHub
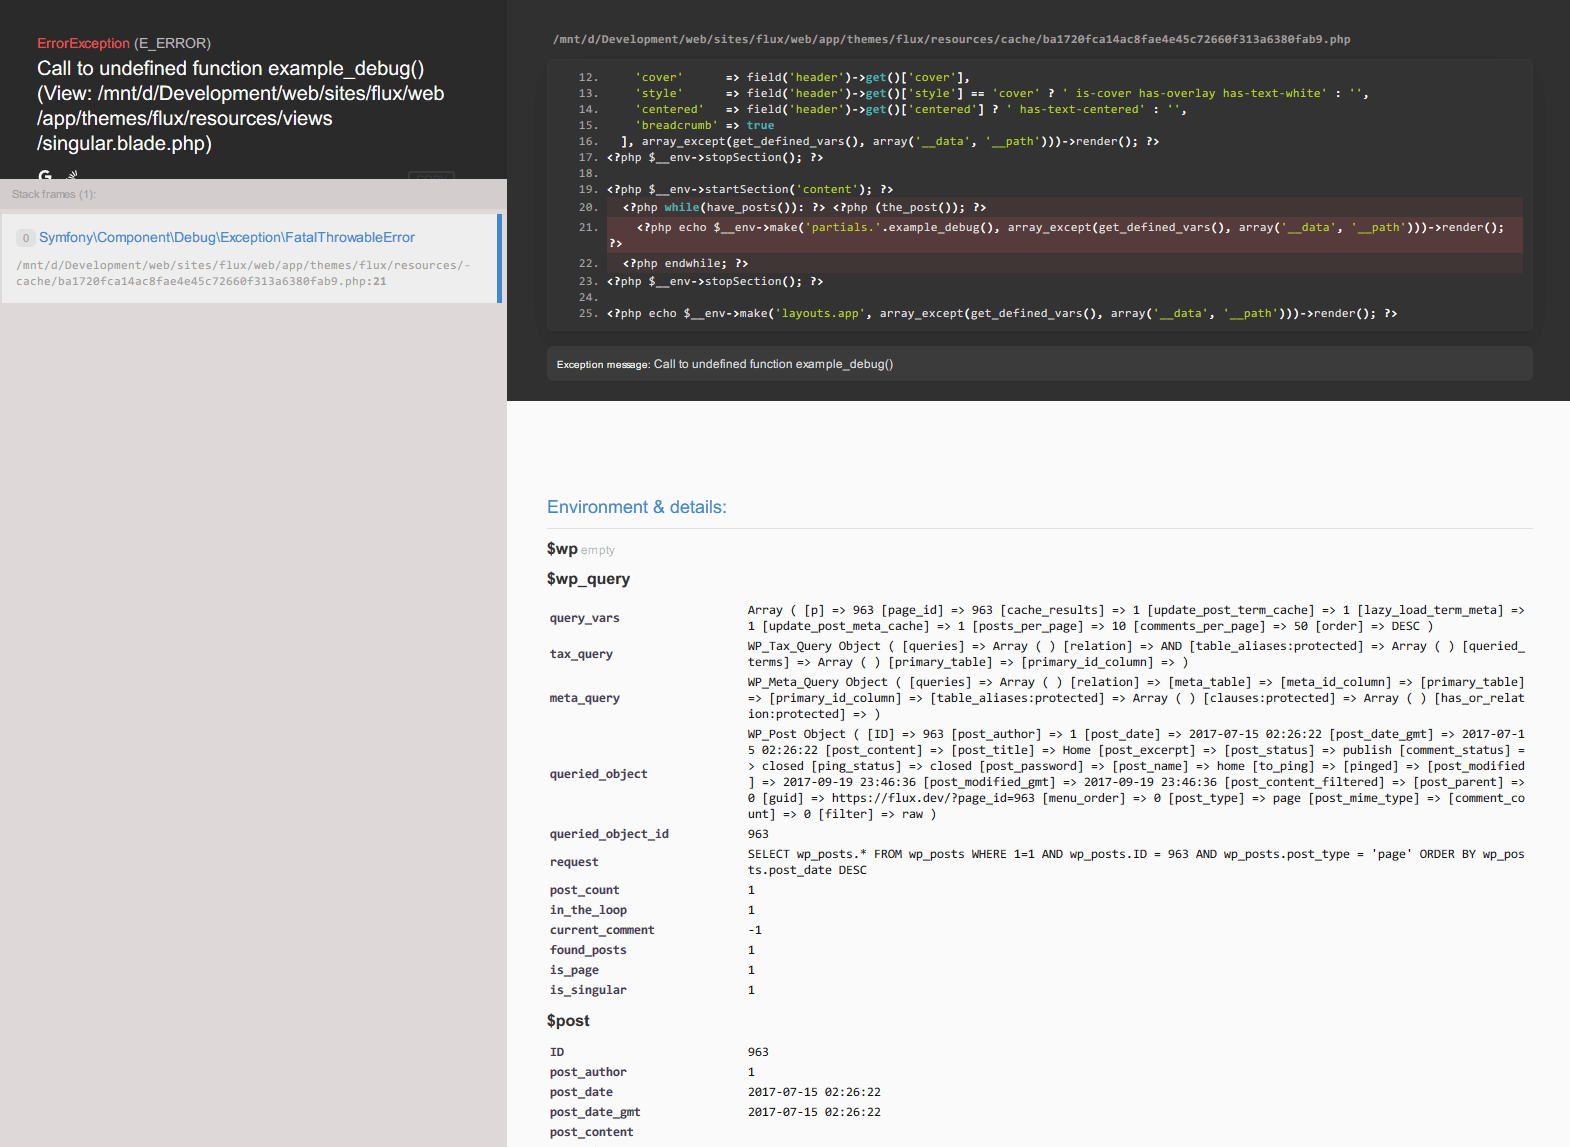
Now, if i run into an error in a blade file:

On the left side, the path resources/views/singular.blade.php is correct.
But to open the file, i have to click the link on the right side. But this is just the cache.
Is it possible to use the file from the left side for opening files in PhpStorm?
Thx for any help.
1 Like
I am a newbie to sage, but I have worked with Laravel. What I found to be successful with debugging a Laravel template type of system, is to place your break point in the controller related to your blade.
For instance, if you are looking at blade called template-home.blade.php, then more than likely you have a controller called TemplateHome.php in the app folder. Place your breakpoint somewhere in that controller, then you will have to press F7 (Step into) forever, until you come to a cached version of your blade.
At that point, stop your debugging and place a breakpoint in cached version of your blade, then restart the debugging process. Only this time, when you hit the first break point in the controller, then you press Shift F8 to step, which will take you to your next break point in the cached blade.
From there press F7 until you find your error.
I was going nuts on why I could not have my break point work and I knew that I had just recently stepped through code, when I realized that it was because I had my break point the controller.
Hope that helps