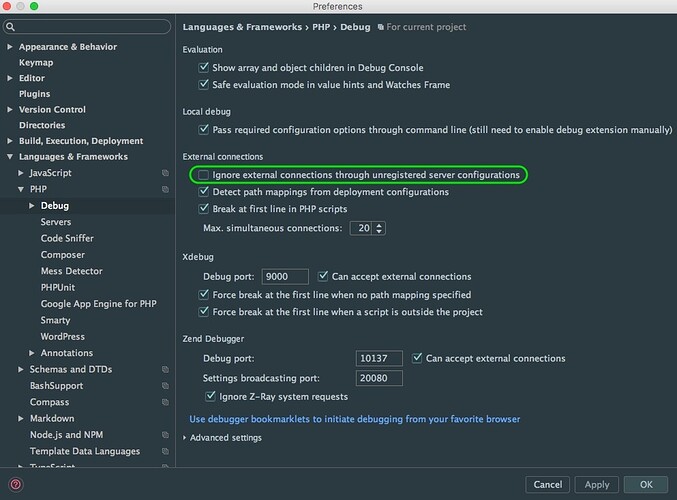
I had been having a hard time getting Xdebug going in Trellis with PhpStorm’s debugger. It was easy to get setup in VVV but I could never get the path mappings right in Trellis. Turns out it’s super easy with PhpStorm’s Zero-Configuration Debugging.
I did a quick screen cast if anyone is interested:
…but the short of it is:
- Install one of the JetBrains bookmarklets, or use a browser extension like this one for Firefox, or this one for Chrome, or whatever.
- Give your extension the IDE key
XDEBUG - Set a breakpoint and tell PhpStorm to start listening for connections
- Refresh your browser and accept the default mappings that PhpStorm detects
I’m digging the Roots stack but was really missing my debugger as it’s helped me to learn a ton. It’s great to have it back.
Hope this is helpful to someone.


