Thought I would share a debugging technique that’s working out well for me at the moment. I’ve never had any successes getting Xdebug and VS Code to play nicely but this technique also covers Advanced Custom Fields too.
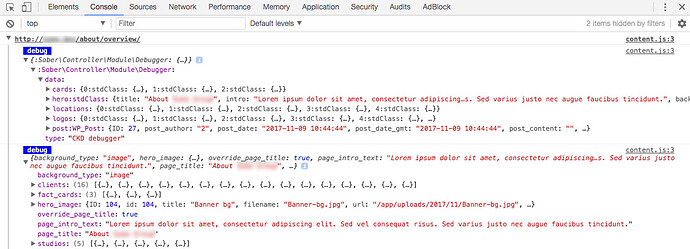
The goal is here is to move PHP/Xdebug errors into Chrome’s dev tools console, as well as returning all available controller data (including WP_Post data) and all available ACF field data, also within the console.
In the below screenshot, you’ll see two debug entries in the console. The top entry is all of the controller data being passed to the template. The bottom entry is all of field data for the given page.
From here you can drill down into any of the variables being passed by the controller or any field groups from ACF:
Method
- Install the Chrome extension PHP Console
- Install the WordPress plugin WP PHP Console on your site
- Active the WP PHP Console plugin and navigate to Settings → WP PHP Console. You’ll need to enter a password (you’ll use this later to authenticate the Chrome Extension) and then make sure to check the
Register PC Classcheckbox. Finally, Save Changes - Somewhere in your theme (I’d recommend your header as this will appear on every page) you need to add the following:
.
@php
if ($_SERVER['WP_ENV'] == 'development') {
  $controller = new \Sober\Controller\Module\Debugger(get_defined_vars(), 'Debugger');
  $fields = get_fields();
  PC::debug($controller);
  PC::debug($fields);
}
@endphp
Quick explanation of the above. Firstly, a quick check that we’re in the development environment in case this gets left in when deploying to production. We’re then creating two variables, one that leverages the controller’s get_defined_vars function and one that stores all ACF field data using ACF’s get_fields function. We then pass that to the WP PHP Console plugin via PC::debug($debug).
- Now we just need to visit your dev URL, click the padlock icon in the toolbar (from the Chrome extension) and enter the password you added to the plugin’s settings page
- Reload the page and check out your console!
I’ve found this to be really useful. When writing controller methods, I can see all my field data and drill down into any arrays that are passed by ACF. This massively reducing chances of typos in fields names or needing to either look up what ACF returns via the docs or by var_dumping as I go. Then the controller data is extremely useful when writing views and debugging any controller issues. As a bonus, we also remove any errors from being displayed on the page itself and instead these are also moved to the console. This ensures they are always fully readable and not obscured by any page elements (fixed headers, narrow containers etc.).
Hope that’s of some use to anyone and let me know if anything isn’t clear.


