- We’re running PHP 8.0.15 on the local & remote servers
- PHP opcache settings:
| Opcode Caching |
Up and Running |
| Optimization |
Enabled |
| SHM Cache |
Enabled |
| File Cache |
Disabled |
| JIT |
Disabled |
| Startup |
OK |
| Shared memory model |
mmap |
| Cache hits |
15787411 |
| Cache misses |
4270 |
| Used memory |
75550824 |
| Free memory |
58665824 |
| Wasted memory |
1080 |
| Interned Strings Used memory |
6290992 |
| Interned Strings Free memory |
0 |
| Cached scripts |
3186 |
| Cached keys |
5202 |
| Max keys |
7963 |
| OOM restarts |
0 |
| Hash keys restarts |
0 |
| Manual restarts |
0 |
| Directive |
Local Value |
Master Value |
| opcache.blacklist_filename |
no value |
no value |
| opcache.consistency_checks |
0 |
0 |
| opcache.dups_fix |
Off |
Off |
| opcache.enable |
On |
On |
| opcache.enable_cli |
On |
On |
| opcache.enable_file_override |
Off |
Off |
| opcache.error_log |
no value |
no value |
| opcache.file_cache |
no value |
no value |
| opcache.file_cache_consistency_checks |
On |
On |
| opcache.file_cache_only |
Off |
Off |
| opcache.file_update_protection |
2 |
2 |
| opcache.force_restart_timeout |
180 |
180 |
| opcache.huge_code_pages |
Off |
Off |
| opcache.interned_strings_buffer |
8 |
8 |
| opcache.jit |
tracing |
tracing |
| opcache.jit_bisect_limit |
0 |
0 |
| opcache.jit_blacklist_root_trace |
16 |
16 |
| opcache.jit_blacklist_side_trace |
8 |
8 |
| opcache.jit_buffer_size |
0 |
0 |
| opcache.jit_debug |
0 |
0 |
| opcache.jit_hot_func |
127 |
127 |
| opcache.jit_hot_loop |
64 |
64 |
| opcache.jit_hot_return |
8 |
8 |
| opcache.jit_hot_side_exit |
8 |
8 |
| opcache.jit_max_exit_counters |
8192 |
8192 |
| opcache.jit_max_loop_unrolls |
8 |
8 |
| opcache.jit_max_polymorphic_calls |
2 |
2 |
| opcache.jit_max_recursive_calls |
2 |
2 |
| opcache.jit_max_recursive_returns |
2 |
2 |
| opcache.jit_max_root_traces |
1024 |
1024 |
| opcache.jit_max_side_traces |
128 |
128 |
| opcache.jit_prof_threshold |
0.005 |
0.005 |
| opcache.lockfile_path |
/tmp |
/tmp |
| opcache.log_verbosity_level |
1 |
1 |
| opcache.max_accelerated_files |
4000 |
4000 |
| opcache.max_file_size |
0 |
0 |
| opcache.max_wasted_percentage |
5 |
5 |
| opcache.memory_consumption |
128 |
128 |
| opcache.opt_debug_level |
0 |
0 |
| opcache.optimization_level |
0x7FFEBFFF |
0x7FFEBFFF |
| opcache.preferred_memory_model |
no value |
no value |
| opcache.preload |
no value |
no value |
| opcache.preload_user |
no value |
no value |
| opcache.protect_memory |
Off |
Off |
| opcache.record_warnings |
Off |
Off |
| opcache.restrict_api |
no value |
no value |
| opcache.revalidate_freq |
60 |
60 |
| opcache.revalidate_path |
Off |
Off |
| opcache.save_comments |
On |
On |
| opcache.use_cwd |
On |
On |
| opcache.validate_permission |
Off |
Off |
| opcache.validate_root |
Off |
Off |
| opcache.validate_timestamps |
On |
On |
PHP realpath settings:
realpath_cache_size => 4096K => 4096K
realpath_cache_ttl => 120 => 120
- Not sure if the average process is actually ~30 Mb. When I log the backend with
htop and do a frontend refresh I can see lots of php-fpm processes coming in and maxing out the CPU, which was the reason to start this thread:
  CPU[||||||||||||||||||||||||||||||||||||||||||||||||||||||||||||||||||||||||||||||||||||||||||||||||||||||||||100.0%]   Tasks: 77, 61 thr; 1 running
  Mem[|||||||||||||||||||||||||||||||||||||||||||||||||||||||||||||||||||||||||||||||                      1014M/1.94G]   Load average: 5.21 2.78 2.78
  Swp[||||||                                                                                                49.8M/954M]   Uptime: 10 days, 18:24:58

    PID USER      PRI  NI  VIRT   RES   SHR S CPU% MEM%   TIME+  Command
 153186 web        20   0  252M 98372 72500 R  6.2  4.8  0:01.35 php-fpm: pool wordpress
 153188 web        20   0  251M 96428 71196 R  6.2  4.7  0:01.22 php-fpm: pool wordpress
 153190 web        20   0  249M 96372 71504 R  6.2  4.7  0:01.21 php-fpm: pool wordpress
 153184 web        20   0  249M 96352 71504 R  6.2  4.7  0:01.23 php-fpm: pool wordpress
 153181 web        20   0  251M 95700 70608 R  6.2  4.7  0:01.20 php-fpm: pool wordpress
 153327 web        20   0  247M 73664 53600 R  6.2  3.6  0:00.12 php-fpm: pool wordpress
 153328 web        20   0  245M 72592 53600 R  6.2  3.6  0:00.12 php-fpm: pool wordpress
 153329 web        20   0  247M 73644 53600 R  6.2  3.6  0:00.12 php-fpm: pool wordpress
 153343 web        20   0  239M 58732 46104 R  6.2  2.9  0:00.05 php-fpm: pool wordpress
 153173 web        20   0  251M 95724 70632 R  0.0  4.7  0:01.22 php-fpm: pool wordpress
 153192 web        20   0  249M 96308 71504 R  0.0  4.7  0:01.23 php-fpm: pool wordpress
 153189 web        20   0  249M 96364 71504 R  0.0  4.7  0:01.23 php-fpm: pool wordpress
 153183 web        20   0  249M 96356 71504 R  0.0  4.7  0:01.22 php-fpm: pool wordpress
 153182 web        20   0  251M 96420 71196 R  0.0  4.7  0:01.22 php-fpm: pool wordpress
 153185 web        20   0  251M 96628 71504 R  0.0  4.8  0:01.21 php-fpm: pool wordpress
 153180 web        20   0  249M 96300 71504 R  0.0  4.7  0:01.20 php-fpm: pool wordpress
 153326 web        20   0  249M 76640 54520 R  0.0  3.8  0:00.15 php-fpm: pool wordpress
 153334 web        20   0  241M 66132 50636 R  0.0  3.3  0:00.08 php-fpm: pool wordpress
 153337 web        20   0  241M 66216 50700 R  0.0  3.3  0:00.08 php-fpm: pool wordpress
 153324 web        20   0  249M 80252 57460 R  0.0  4.0  0:00.19 php-fpm: pool wordpress
 153330 web        20   0  247M 73908 53600 R  0.0  3.6  0:00.12 php-fpm: pool wordpress
 153336 web        20   0  241M 66200 50700 R  0.0  3.3  0:00.08 php-fpm: pool wordpress
 153339 root       20   0  239M 58720 46104 R  0.0  2.9  0:00.05 php-fpm: master process (/etc/php/8.0/fpm/php-fpm.conf)
 153341 root       20   0  239M 58720 46104 R  0.0  2.9  0:00.05 php-fpm: master process (/etc/php/8.0/fpm/php-fpm.conf)
 153177 web        20   0  251M 96812 71488 R  0.0  4.8  0:01.24 php-fpm: pool wordpress
 153191 web        20   0  251M 96608 71504 R  0.0  4.8  0:01.23 php-fpm: pool wordpress
 153332 web        20   0  241M 65864 50508 R  0.0  3.2  0:00.08 php-fpm: pool wordpress
 153333 web        20   0  241M 66220 50700 R  0.0  3.3  0:00.08 php-fpm: pool wordpress
Since the logs displayed a suggestion:
[pool wordpress] server reached pm.max_children setting (10), consider raising it
We increased the max_children to 40, do you think this is too hight now?
I also noticed the VIRT column never exceeds the 256M while the memory_limit is set to 512M?
- Yes the frontend as well as the backend are both DO droplets:
Frontend Docker: 1 GB / 1 vCPU
Backend Trellis: 2 GB / 1 AMD vCPU
Could the AMD processors somehow be causing any of these issues?
Only the frontend is running in a docker container without php, just node.
We did try increasing the production droplet to: 2 GB / 2 AMD vCPUs and it did solve the problem slightly, but the CPU still spikes to 100% on both on a simple frontend page load.
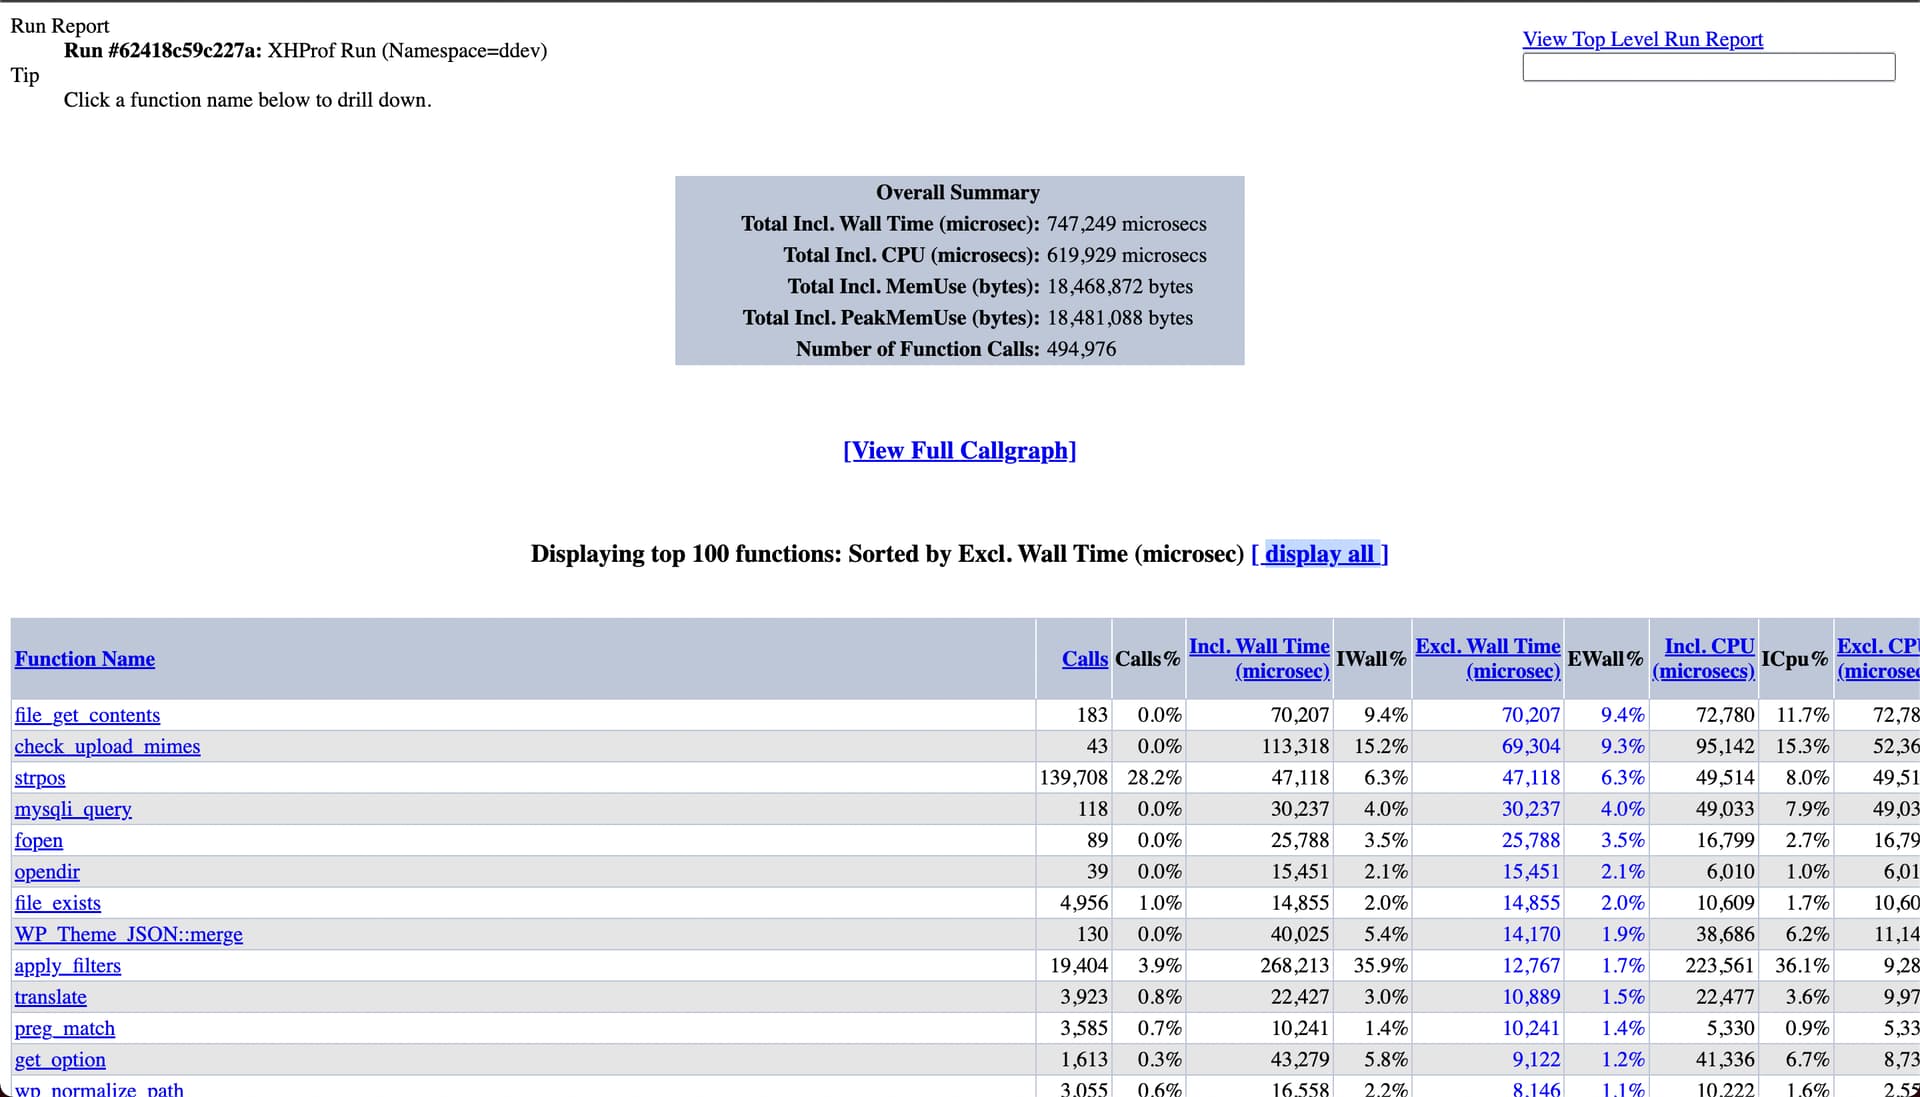
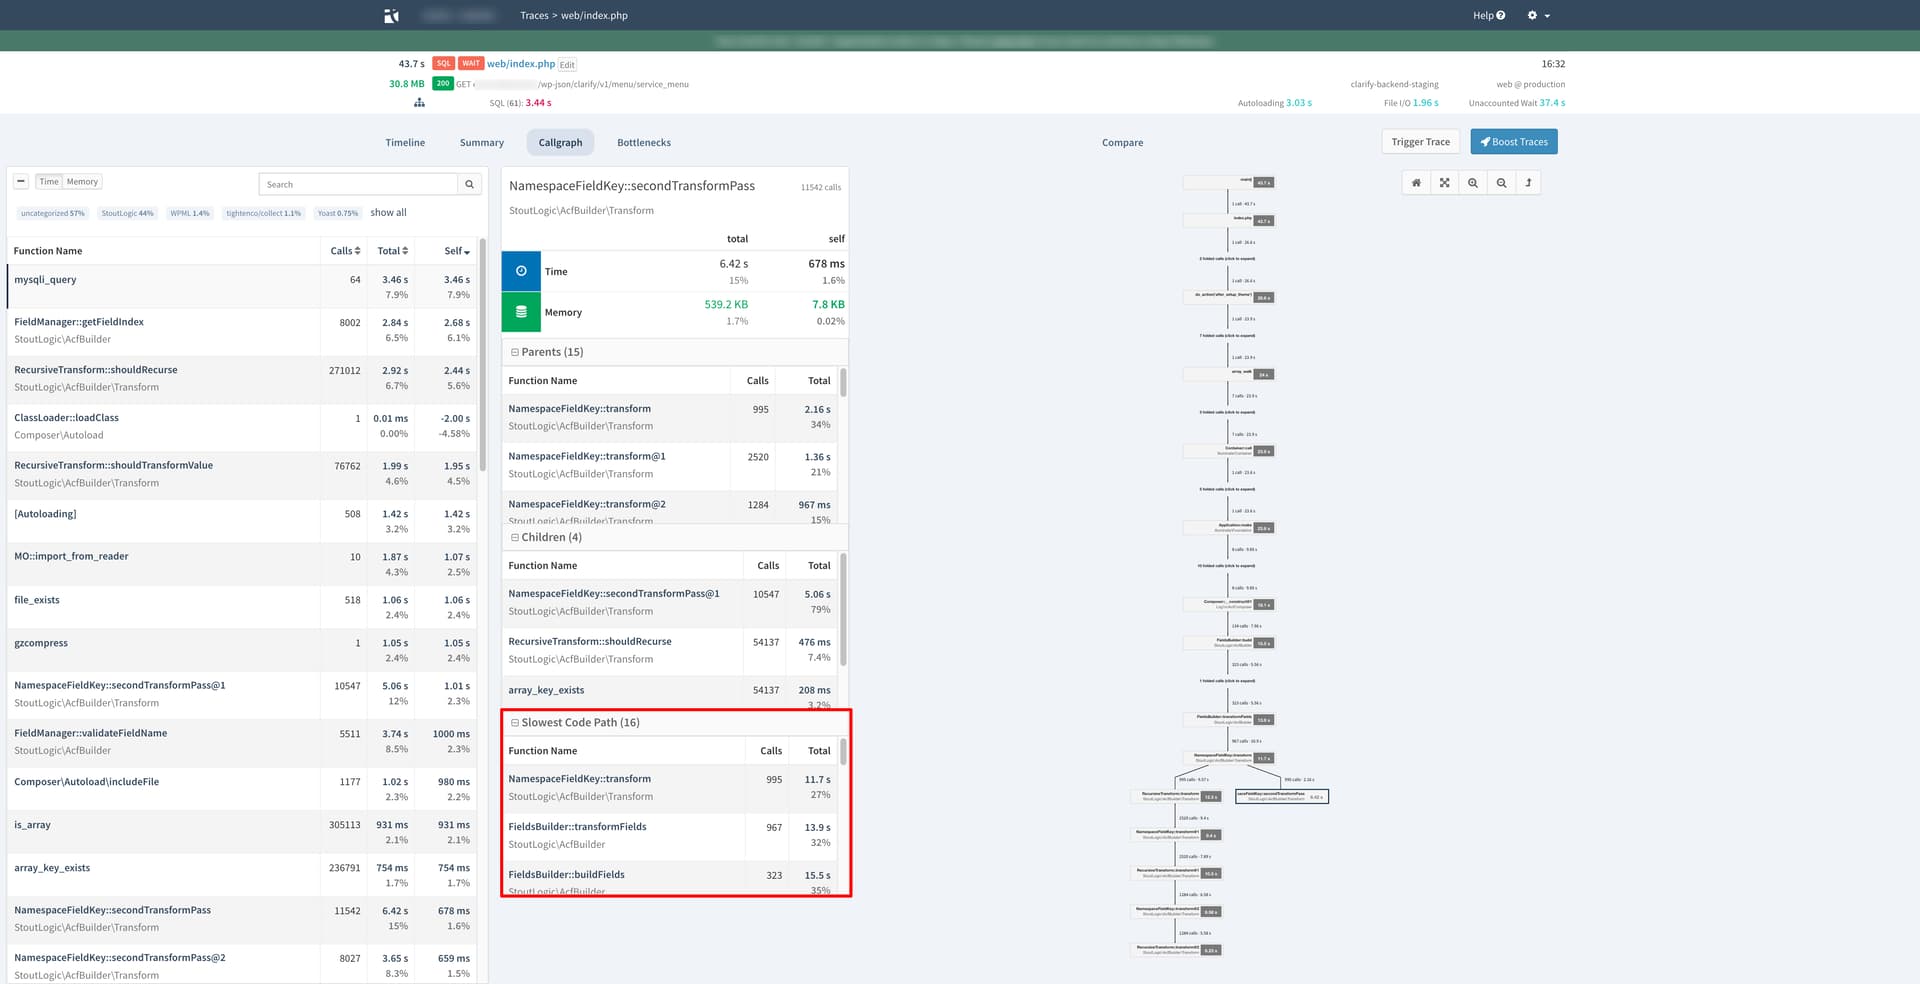
- No there definitely aren’t 5511 fields, more like 50 or so.
I think the big difference is that we’re using our Sage 10 theme only as an API provider with tools like acf-composer & poet.
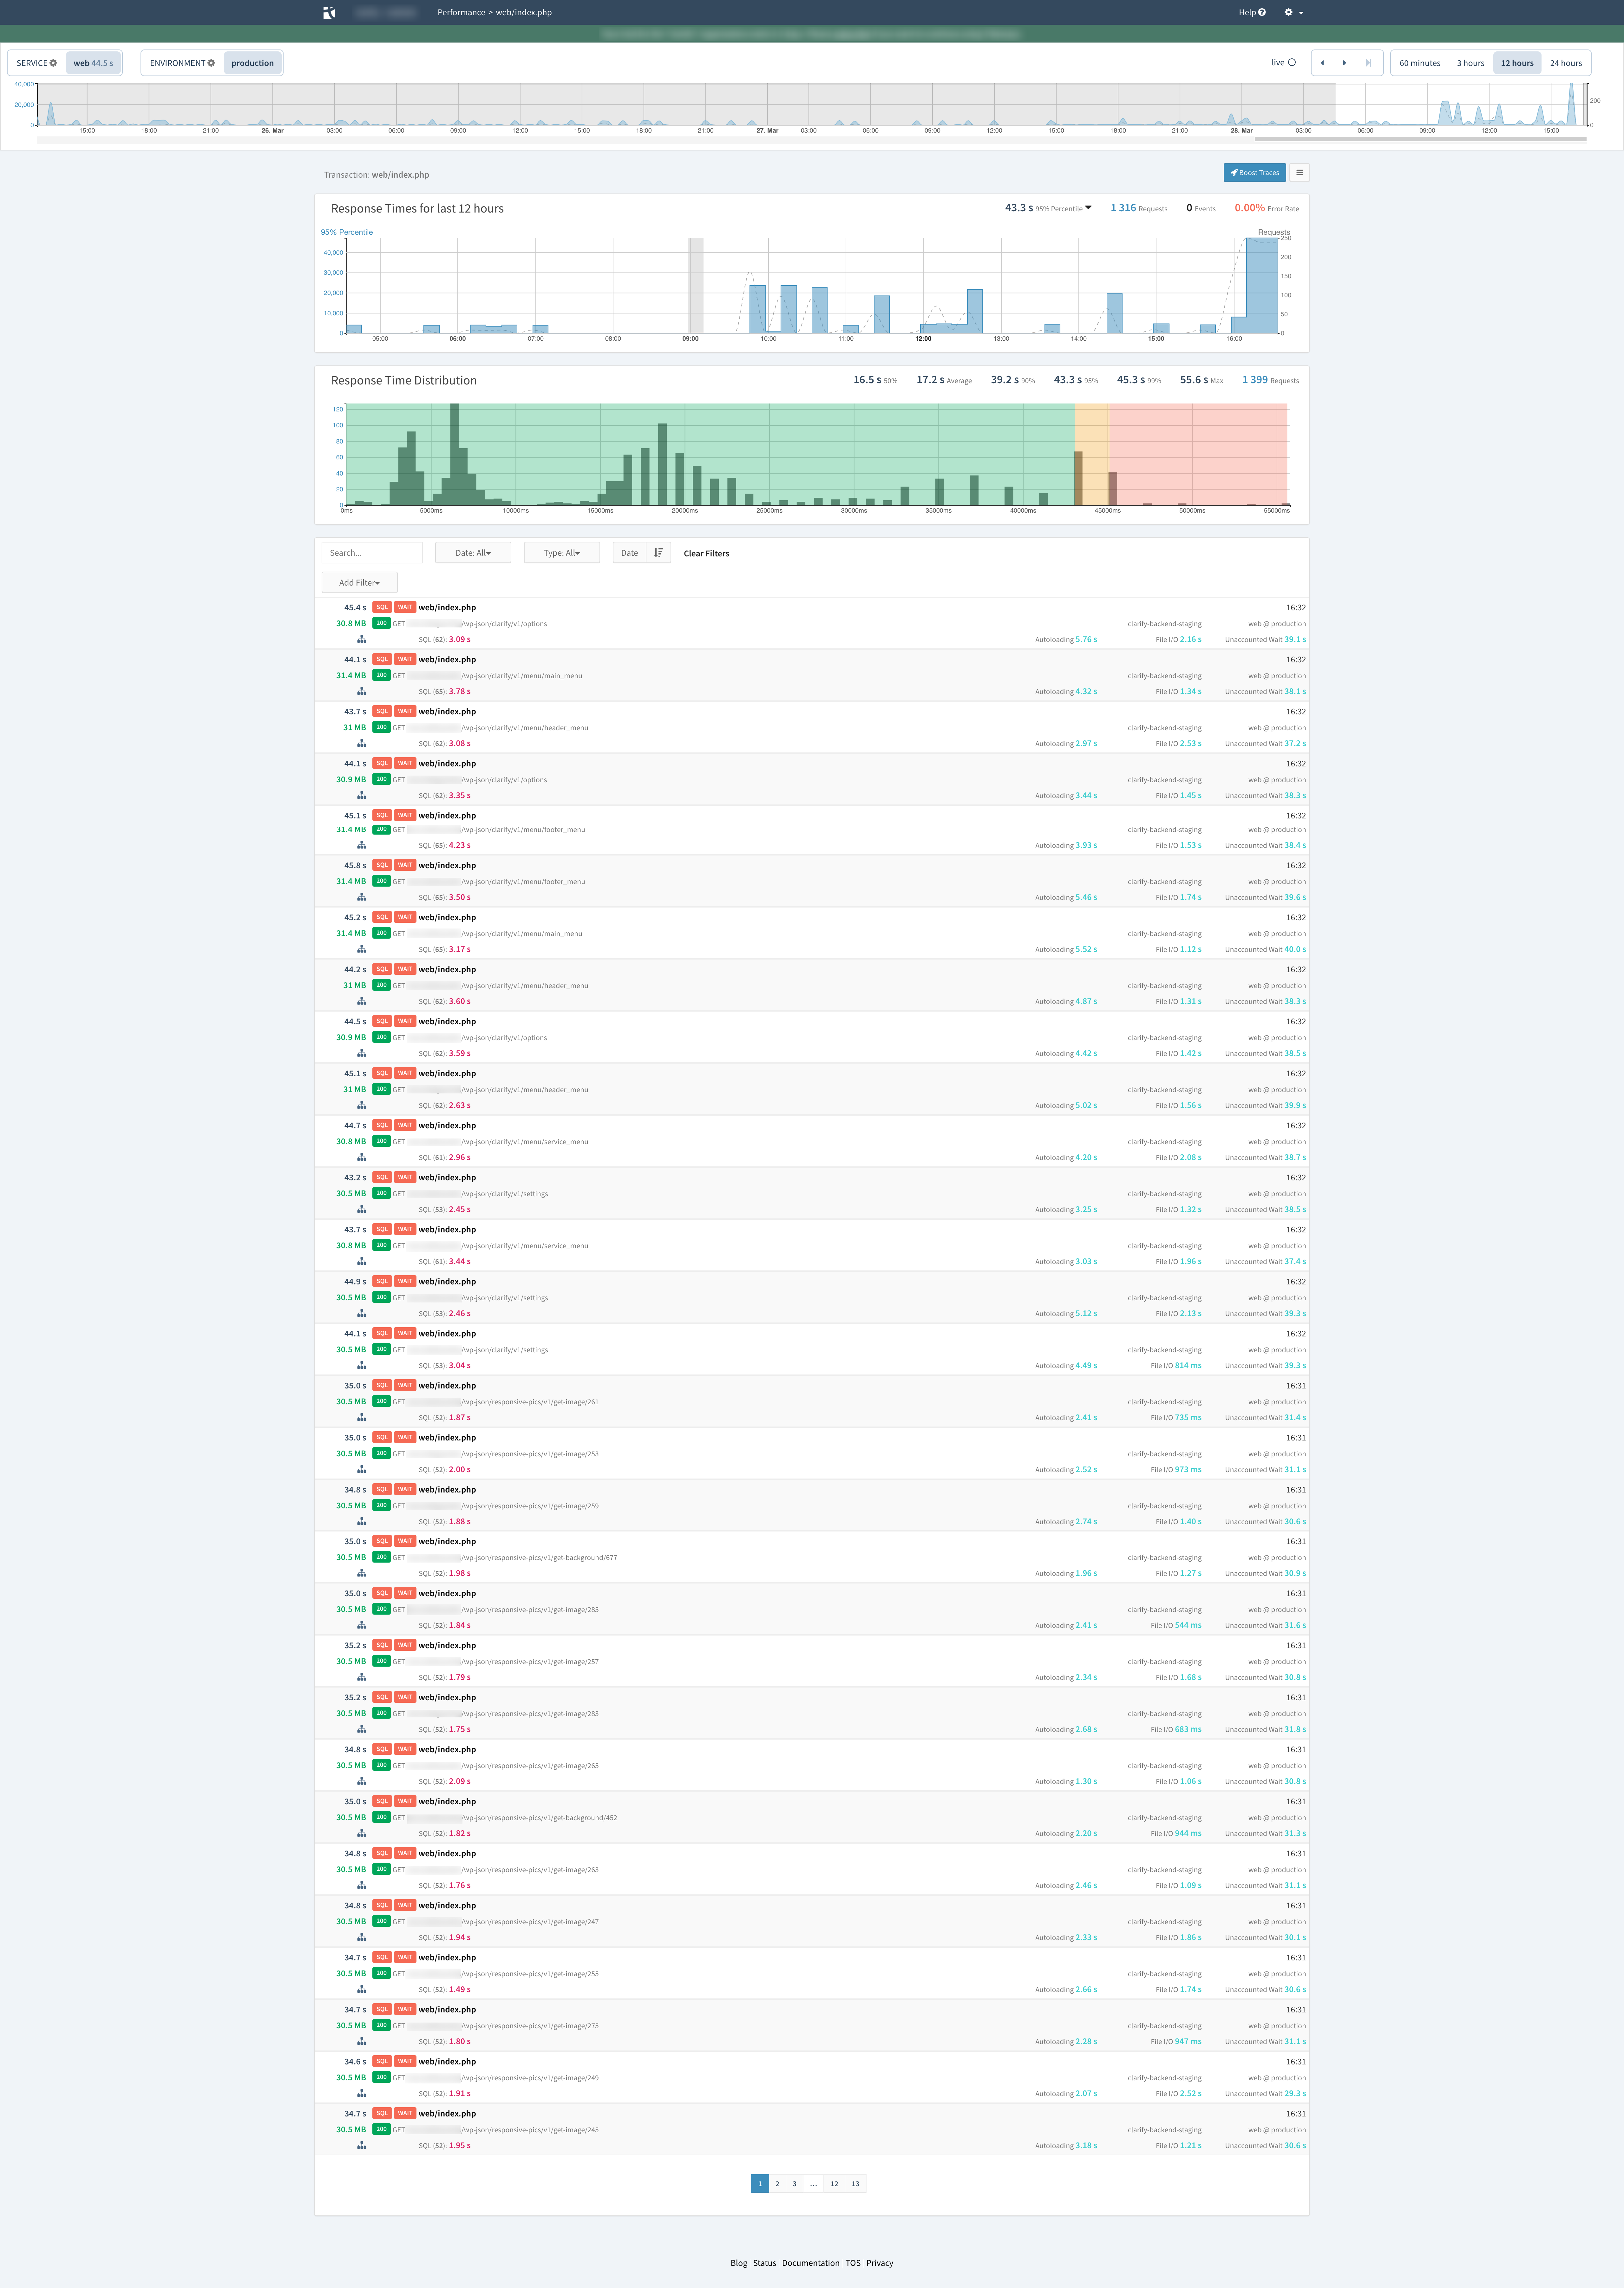
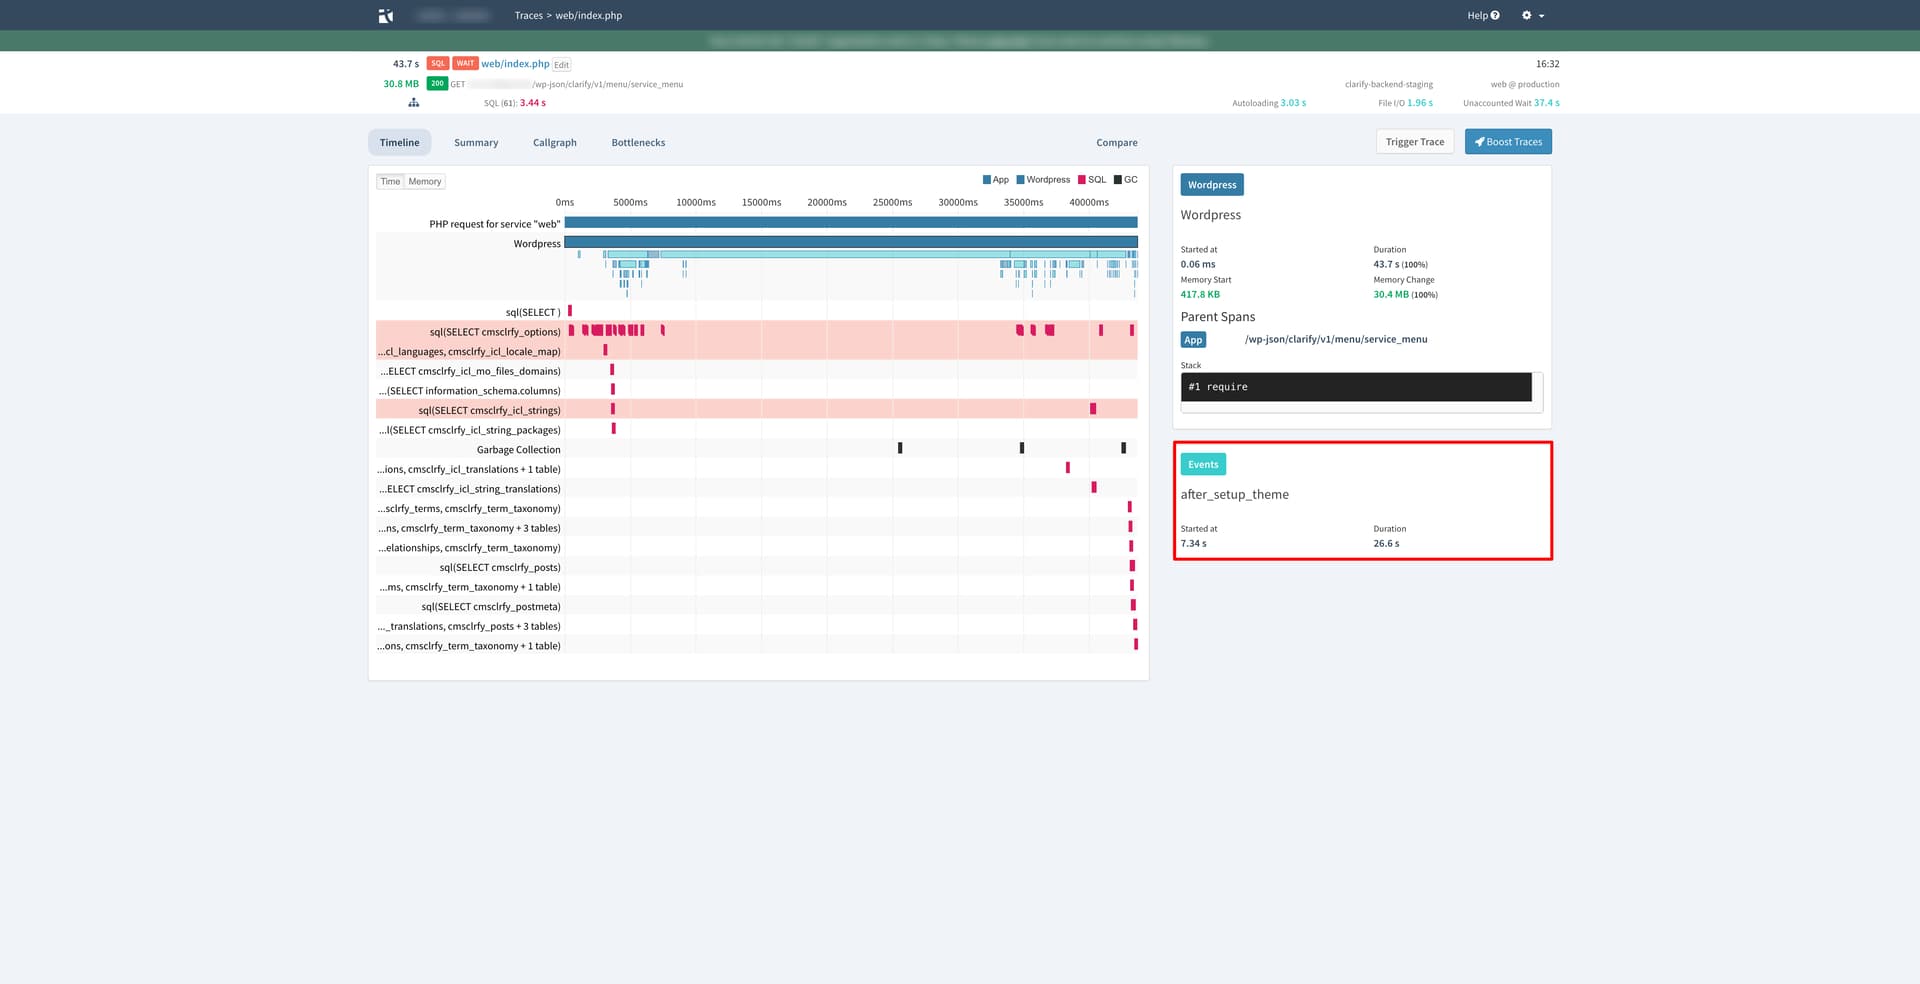
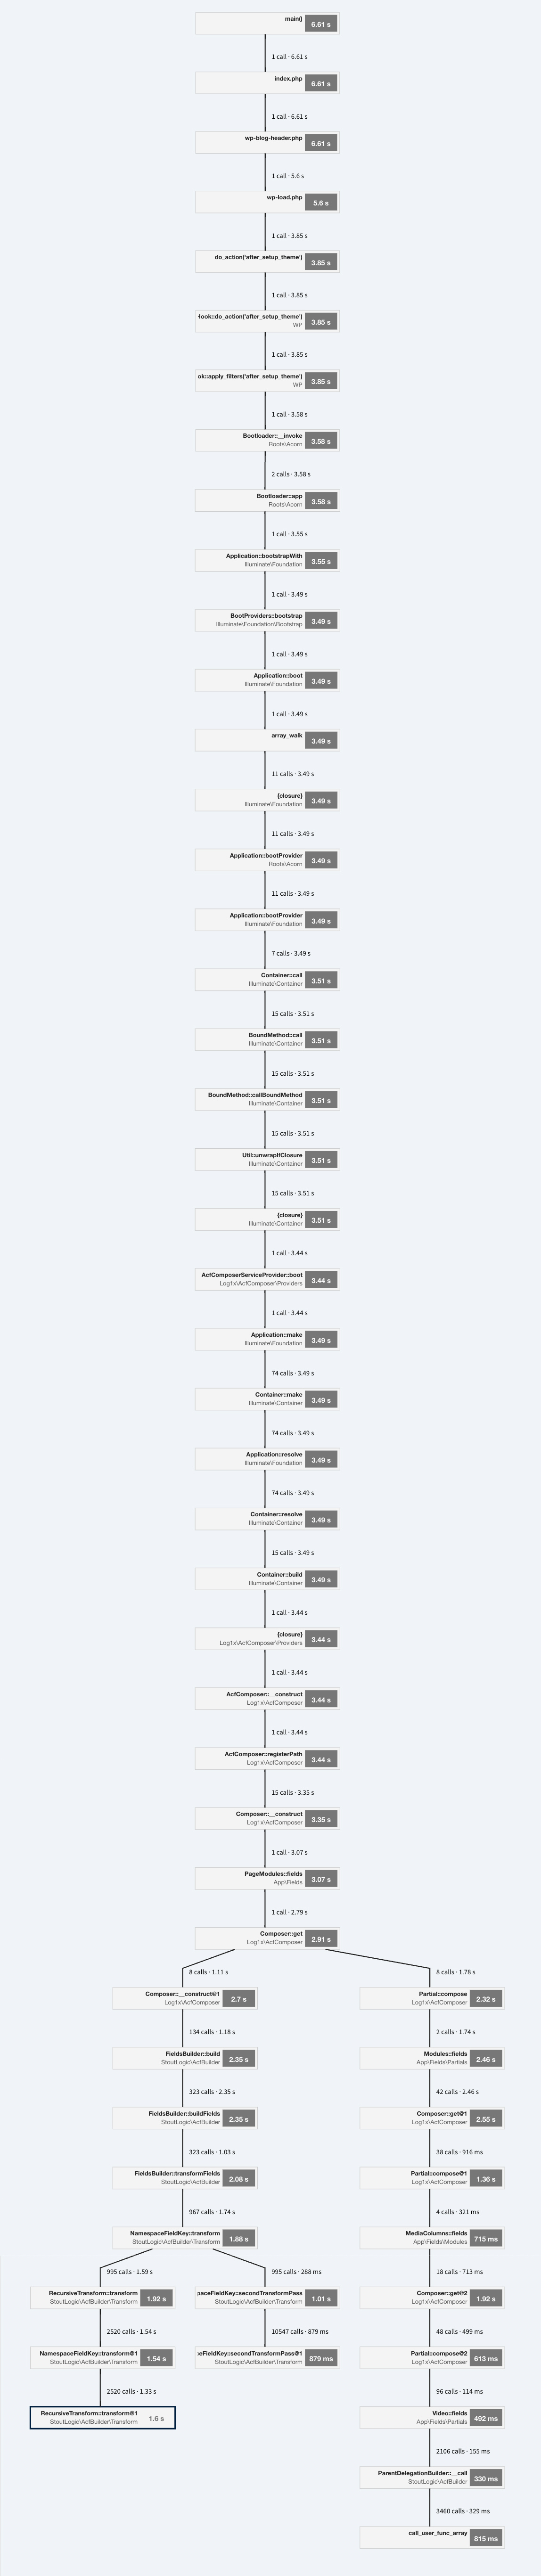
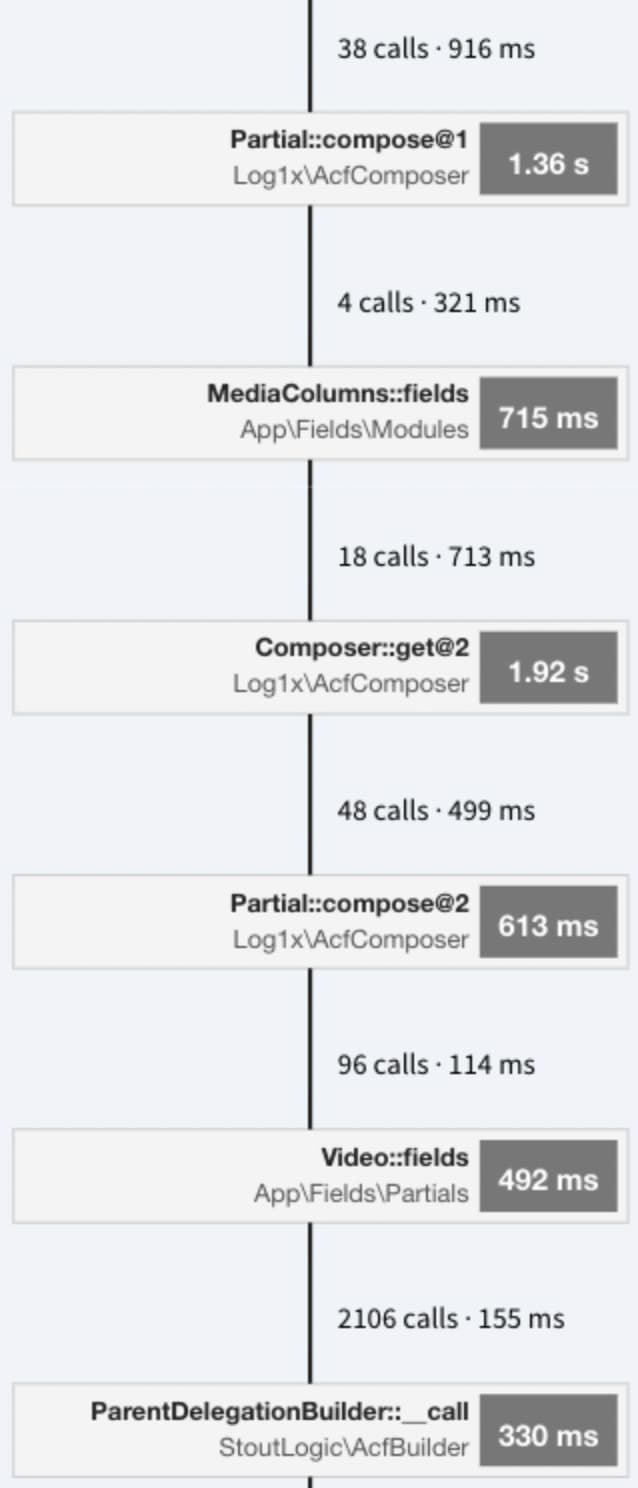
On a frontend page load, multiple REST API request are made (at least 5, but could be 10) and we can see those are clogging up the memory and response times, the first request is ok, 2nd is already slower and 3rd one even more.
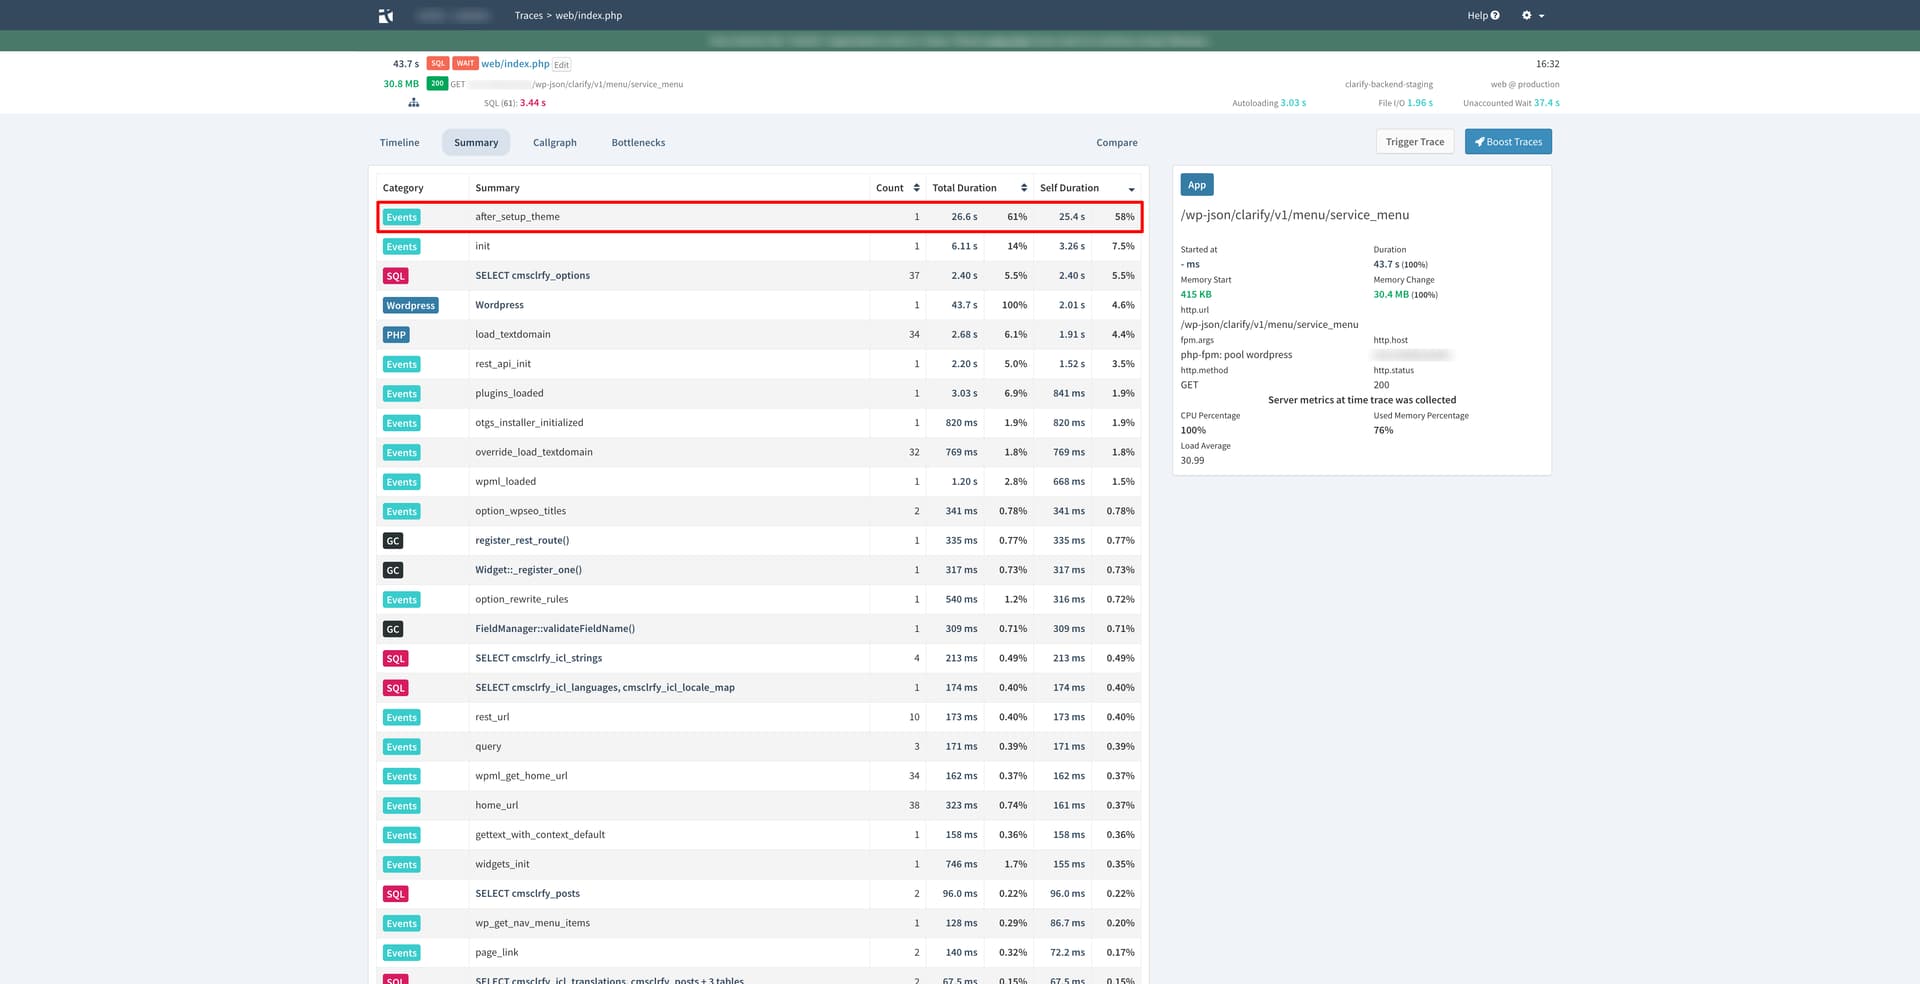
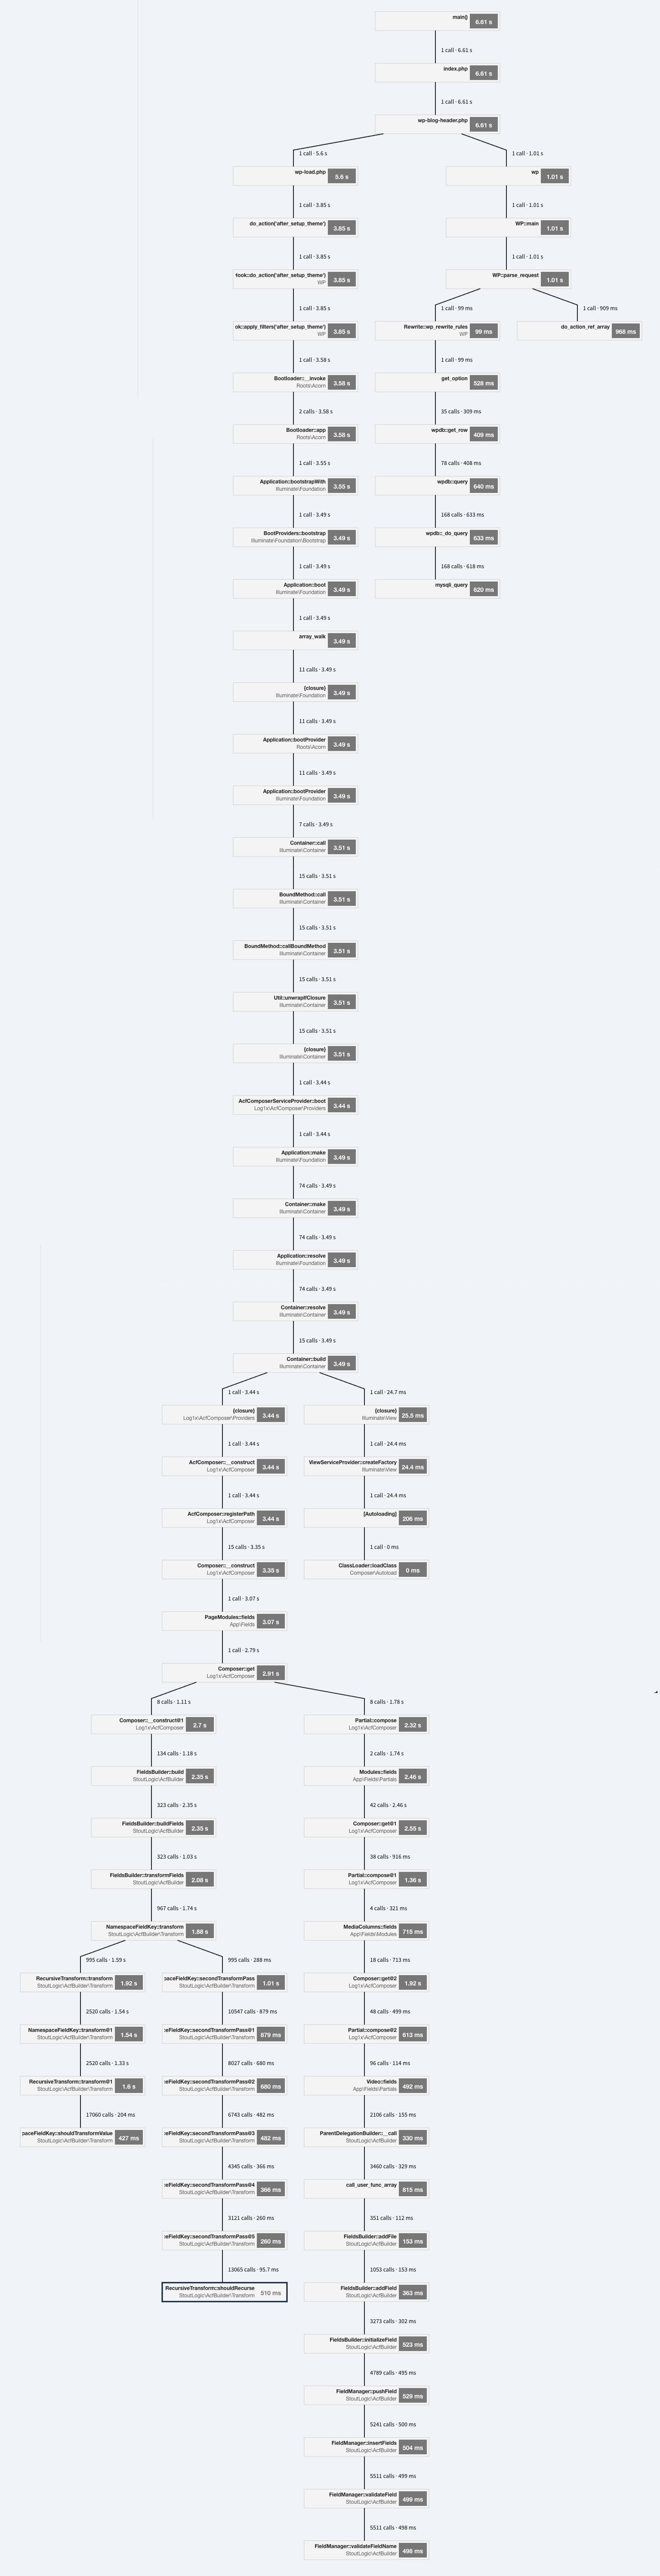
Basically on every API request the \Roots\bootloader is trying to load the Laravel framework, which for us, is only required so we can use acf-composer & poet.
Could that be the cullprit?
Thanks!