I’m running a headless Wordpress instance on a Digital Ocean Droplet (1 AMD vCPU, 2GB, 25GB disk). Another Digital Ocean Droplet runs a Next.js app behind NGINX, all inside Docker containers. To give an idea, it’s a simple website, couple of pages with images and text. In previous setups (Sage 9) similar setups worked fine, but somehow in this particular setup, the backend is slow and takes too much CPU even on simple requests.
I’ve monitored the backend server with htop and I can see that a simple curl to one of our frontend urls makes the backend max out its CPU. Occasionally I’ve also seen the backend spin up ~10 php-fpm processes after visiting a page on the frontend.
Maybe related, but developing with this setup locally is almost undoable. A simple frontend page refresh takes ~15 seconds on my computer (Apple MacBook Pro, 2018). I’m using local Parallels for the backend server and local Docker for the frontend server. I’ve timed some simple requests via curl and noticed that starttransfer often takes 5secs, and more often around 3secs. Page refreshes are faster on an M1 computer, but starttransfer still takes longer than expected on a local machine.
I’ve spent quite some time figuring out where things go wrong, but I can’t seem to find a solution. I’ve tried timing request, and it seems to go wrong on the backend side. I don’t know if it’s a network thing, (a combination between the Ingress networks of Docker and the backend server?), or a Trellis misconfiguration.
If anyone has any idea where I could look or which logs I could check, I would appreciate this very much.
Not sure if this is helpful, but I had a similar problem recently that I managed to debug with Query monitor plugin.
Basically I had 400 duplicate requests for every registered menu (1x header and 4x footer) that were being called every time a template was loaded. This is because we had accidentally put the logic in themes/sage/app/View/Composers/App.php, which is loaded upon every template call.
Thanks for your help. I think Nginx is not to blame. I’ve installed a PHP code profiler plugin (“code-profiler”). An uncached request takes 0.6s to execute. Normally requests are cached, so not too worried there.
But what I do see in the logs is this:
[15-Mar-2022 18:58:28] WARNING: [pool wordpress] seems busy (you may need to increase pm.start_servers, or pm.min/max_spare_servers), spawning 16 children, there are 0 idle, and 7 total children

[15-Mar-2022 18:58:29] WARNING: [pool wordpress] seems busy (you may need to increase pm.start_servers, or pm.min/max_spare_servers), spawning 32 children, there are 0 idle, and 8 total children

[15-Mar-2022 18:58:30] WARNING: [pool wordpress] seems busy (you may need to increase pm.start_servers, or pm.min/max_spare_servers), spawning 32 children, there are 0 idle, and 9 total children

[15-Mar-2022 18:58:31] WARNING: [pool wordpress] server reached pm.max_children setting (10), consider raising it
This happens frequently and seems to be linked to the 100% cpu spikes as observed by htop. I’m not sure what it means exactly and if I should just increase php_fpm_pm_start_servers in main.yml.
However the results don’t change. In htop I still see ~8 spawning php-fpm pools when I visit the frontend. Or even when i do a single request to the backend. What are the scenarios that this happens? Too many requests from the frontend to the backend?
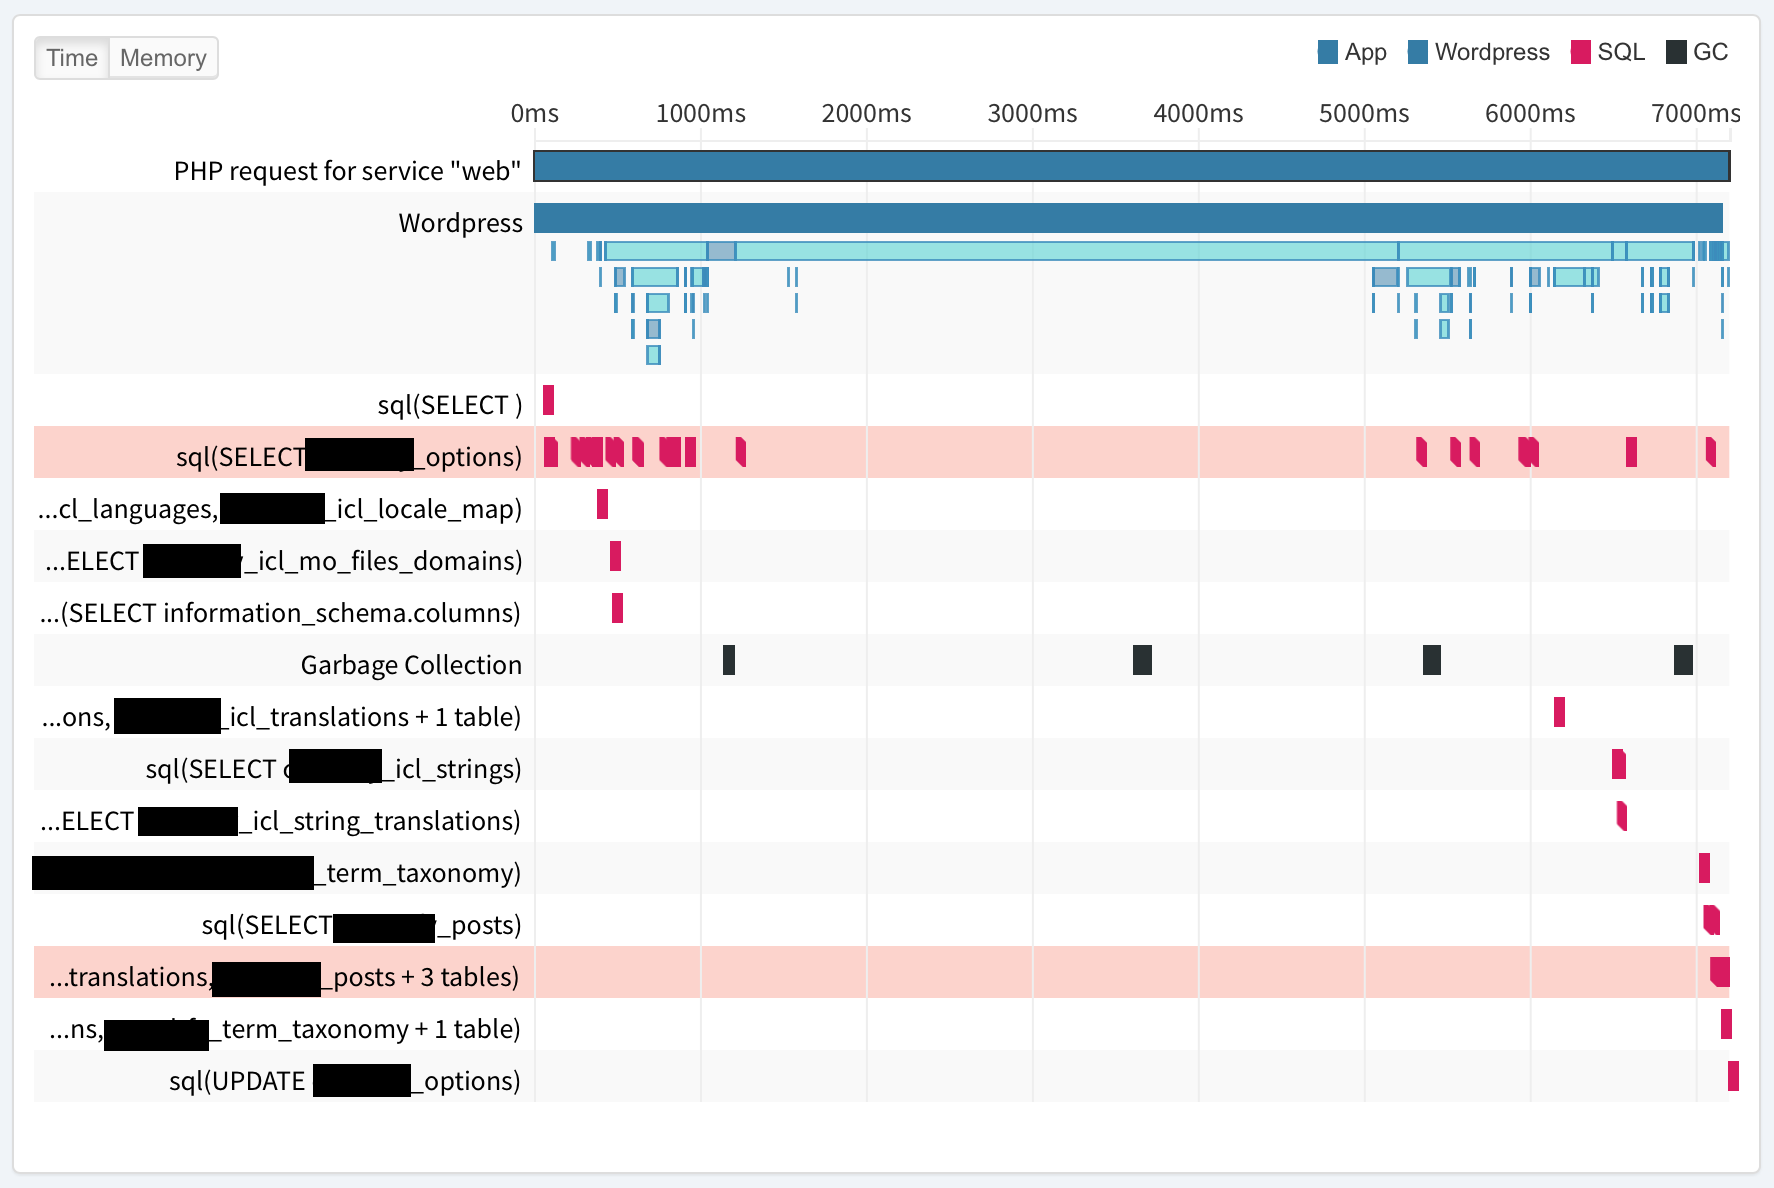
@joaovpmamede no solution yet. I’ve installed a demo of Tideways to monitor request, php and sql execution times. Most requests take a long time, around the 5–7s range. These are some typical results:
We have an API that should serve simple data: header menu info, some global options, image sources. But it looks like each request spends quite some time setting up the global Wordpress theme info. In a previous similar setup we didn’t experience the same slow request times. I have a bit more experience with Node / Express, where you don’t typically run heavy functions in API requests. Seems we might do something wrong here.
Yes we’re using the latest version of Acorn. I was also thinking in that direction (i’m @monokai’s colleague btw)
We’re using the same setup in an older project with sage9 without this performance issue, so I was thinking it was because of the inclusion of laravel indeed
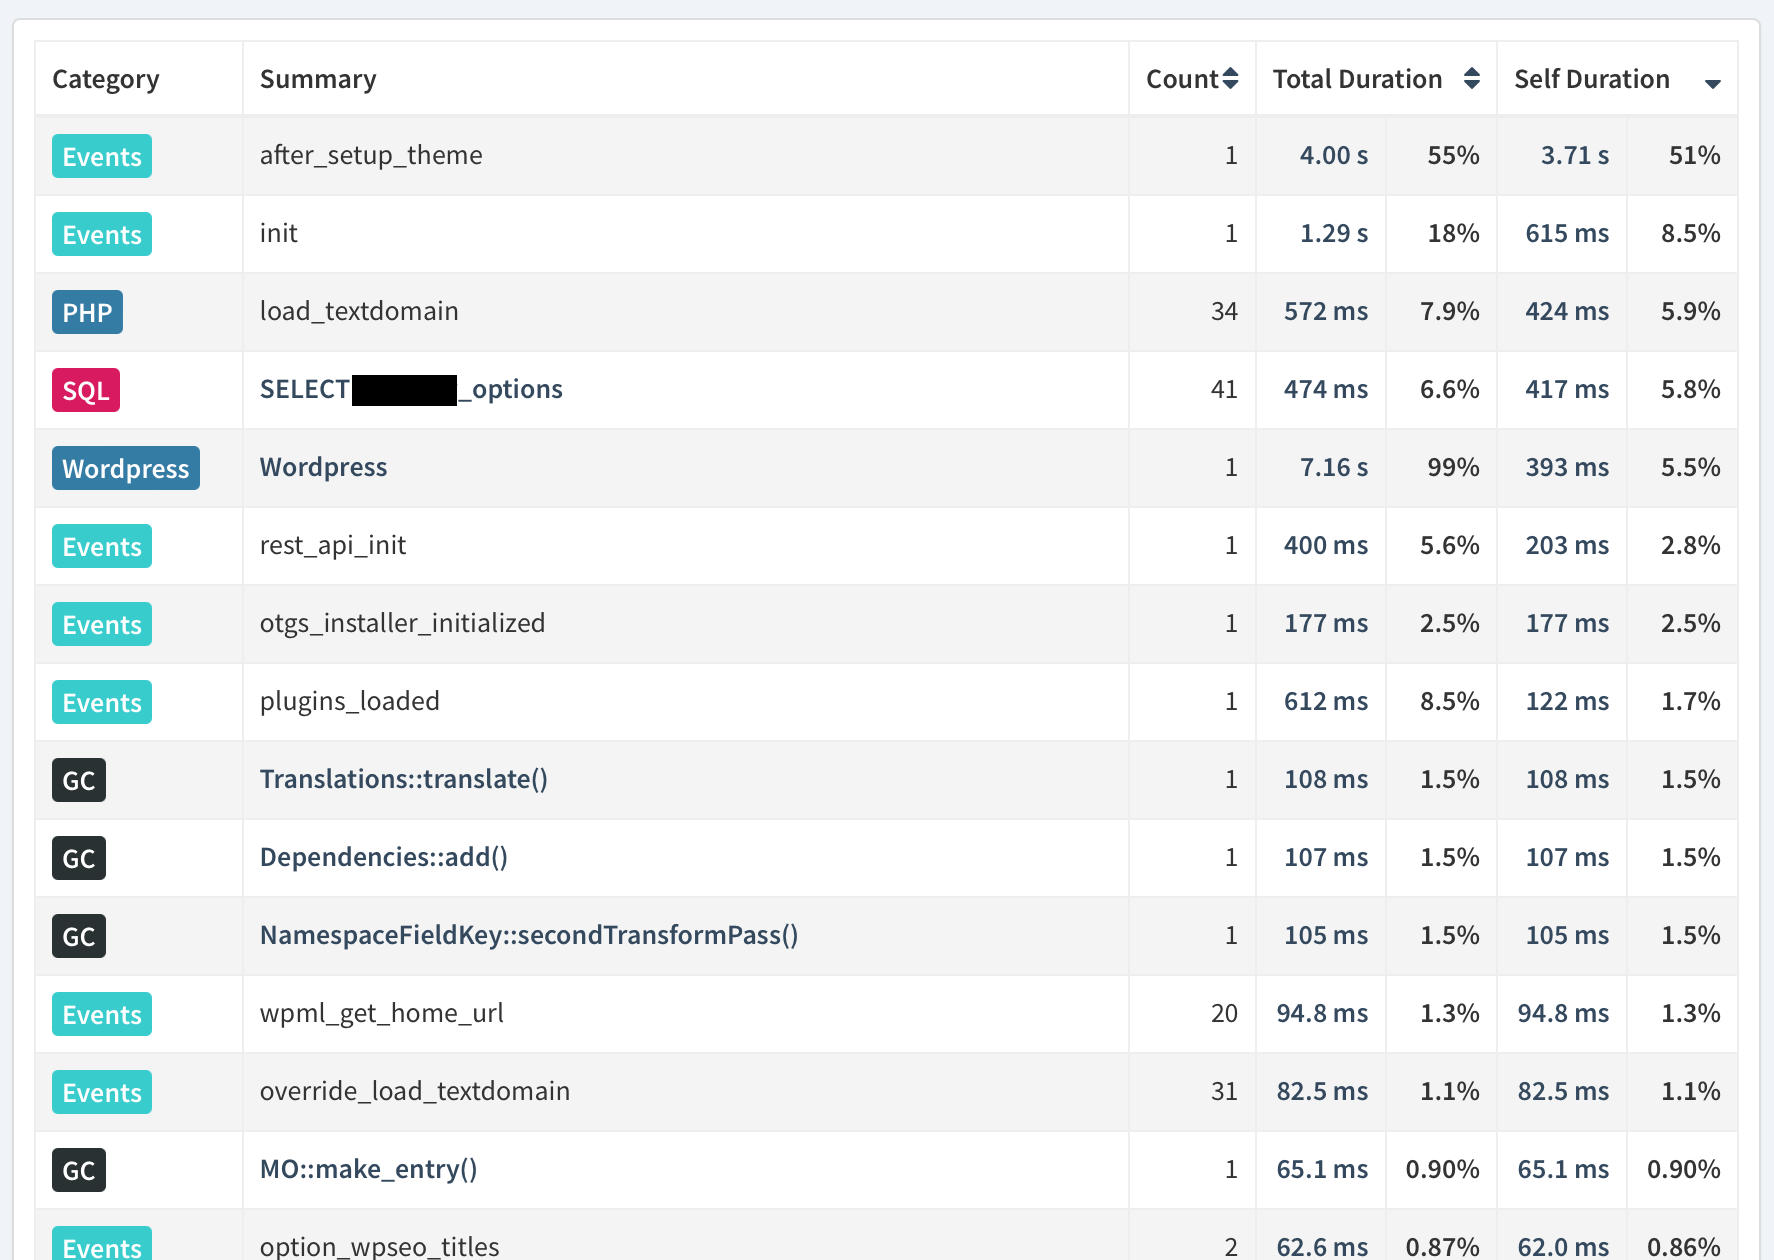
Are you able to drilldown to which PHP functions consume highest exclusive time using Tideways? Since it’s a fork of XHProf and XHProf supports it I would suppose you can. Looks like it’s the Callgraph profiler 5. The Callgraph Profiler :: Documentation
Edit: are those values you show really milliseconds, that’s sort of insane. On a random site of mine the entire main() inclusive time is 600ms with latest acorn.
Since load_textdomain is 424ms it sounds like filesystem access is slow (is_readable, file_exists, composer functions etc)
Thanks a lot for calling out that profiler, this thing is incredibly helpful. Craig and I were digging into this a bit just now and will pick it up again shortly
For reference I have 2 calls to SplFileInfo::getRealPath on a pretty empty site with roots/acorn dev-main. 32 on another site. All calls from Illuminate\Foundation\Bootstrap\LoadConfiguration::getConfigurationFiles
Not stock sage though but I dont think there’s anything different really. Edit: Actually it is a FSE theme so it’s very different (doh), no template_include blade files.
In our case, we’re using the blade-icons package with a couple different icon sets. We needed to run wp acorn icons:cache and the performance issues were solved
@Twansparant@monokai have y’all had any luck digging deeper into the source of your issue?
If you aren’t using blade-icons, are you using another package that might have registered a command that would allow things to be cached? You can check by running wp acorn and looking at the list of commands
Thanks, that IS a very useful tool indeed!
We’re only using log1x/acf-composer & log1x/poet in our theme.
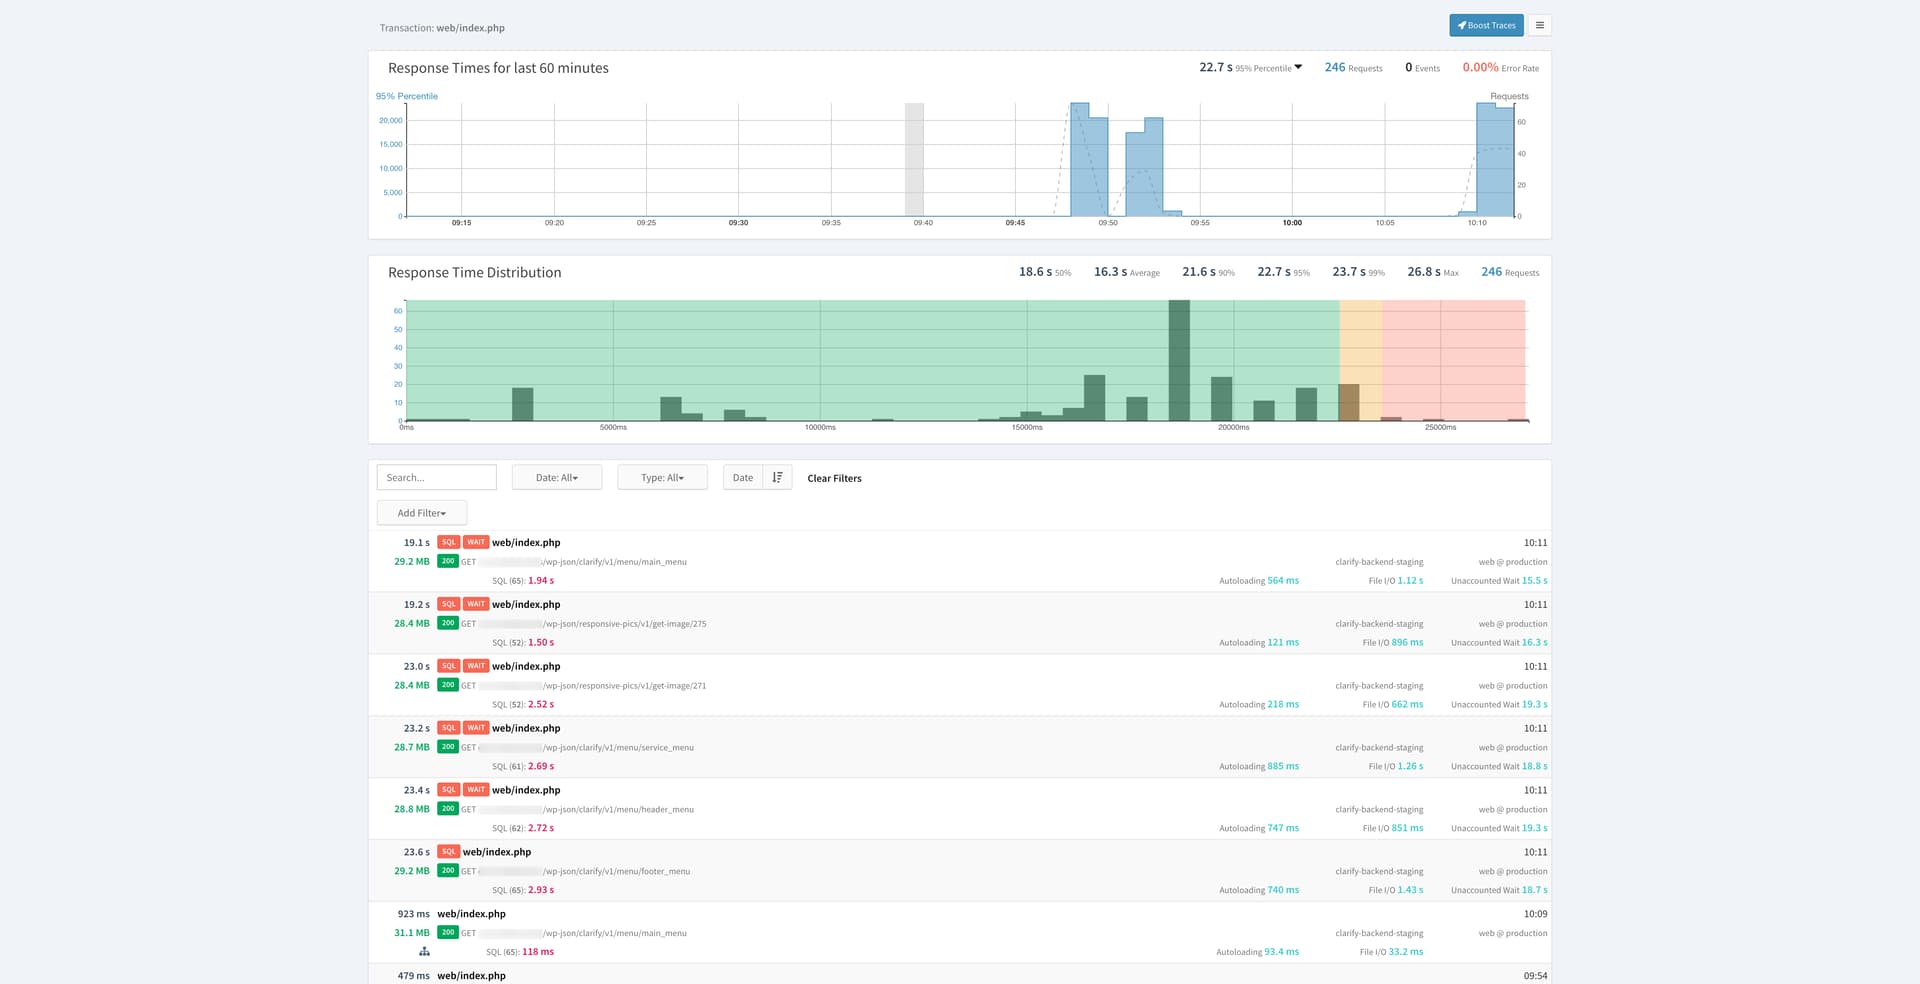
What I don’t understand, is when I look at the timeline of the frontpage in our decoupled next.js page, each single call to the WP REST API through web/index.php is slow.
For example the first call: /wp-json/clarify/v1/menu/main_menu takes 1.94 s!
But when I call that endpoint directly in the browser it’s only 118 ms?
  Acorn 2.0.3 (Laravel 8.81.0)

  USAGE: wp acorn <command> [options] [arguments]

  clear-compiled   Remove the compiled class file
  completion       Dump the shell completion script
  env              Display the current framework environment
  help             Display help for a command
  list             List commands
  optimize         Cache the framework bootstrap files

  acf:block        Create a new ACF block type.
  acf:field        Create a new ACF field group.
  acf:options      Create a new ACF options page.
  acf:partial      Create a new ACF field group partial.
  acf:widget       Create a new ACF sidebar widget.

  acorn:init       Initializes required paths in the base directory.

  config:cache     Create a cache file for faster configuration loading
  config:clear     Remove the configuration cache file

  make:command     Create a new Artisan command
  make:component   Create a new view component class
  make:composer    Create a new view composer class
  make:provider    Create a new service provider class

  optimize:clear   Remove the cached bootstrap files

  package:discover Rebuild the cached package manifest

  vendor:publish   Publish any publishable assets from vendor packages

  view:cache       Compile all of the application's Blade templates
  view:clear       Clear all compiled view files
So not any specific ACF/StoutLogic caching commands?
Do you see anything that’s off?
I think our specific problem lies more in the fact that there are multiple API calls simultaneously, I also don’t exactly understand what the SQL WAIT tags indicate? How can this be avoided?
EDIT:
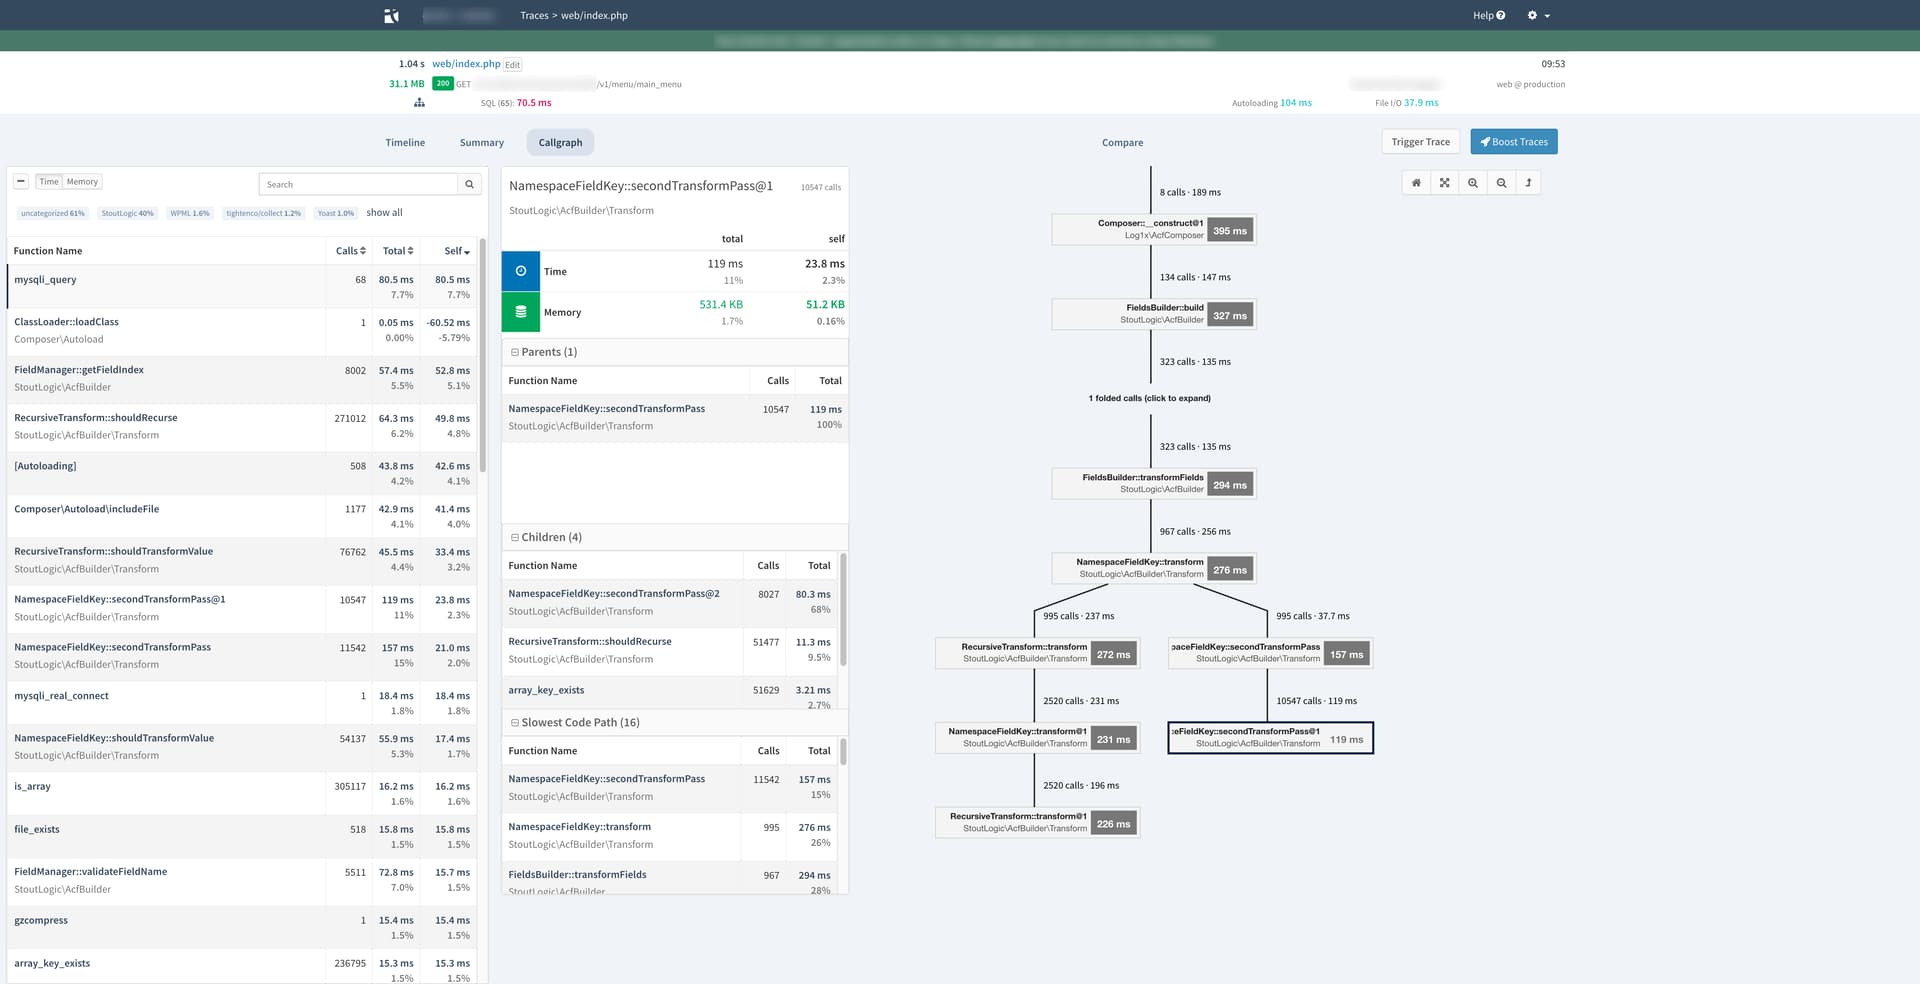
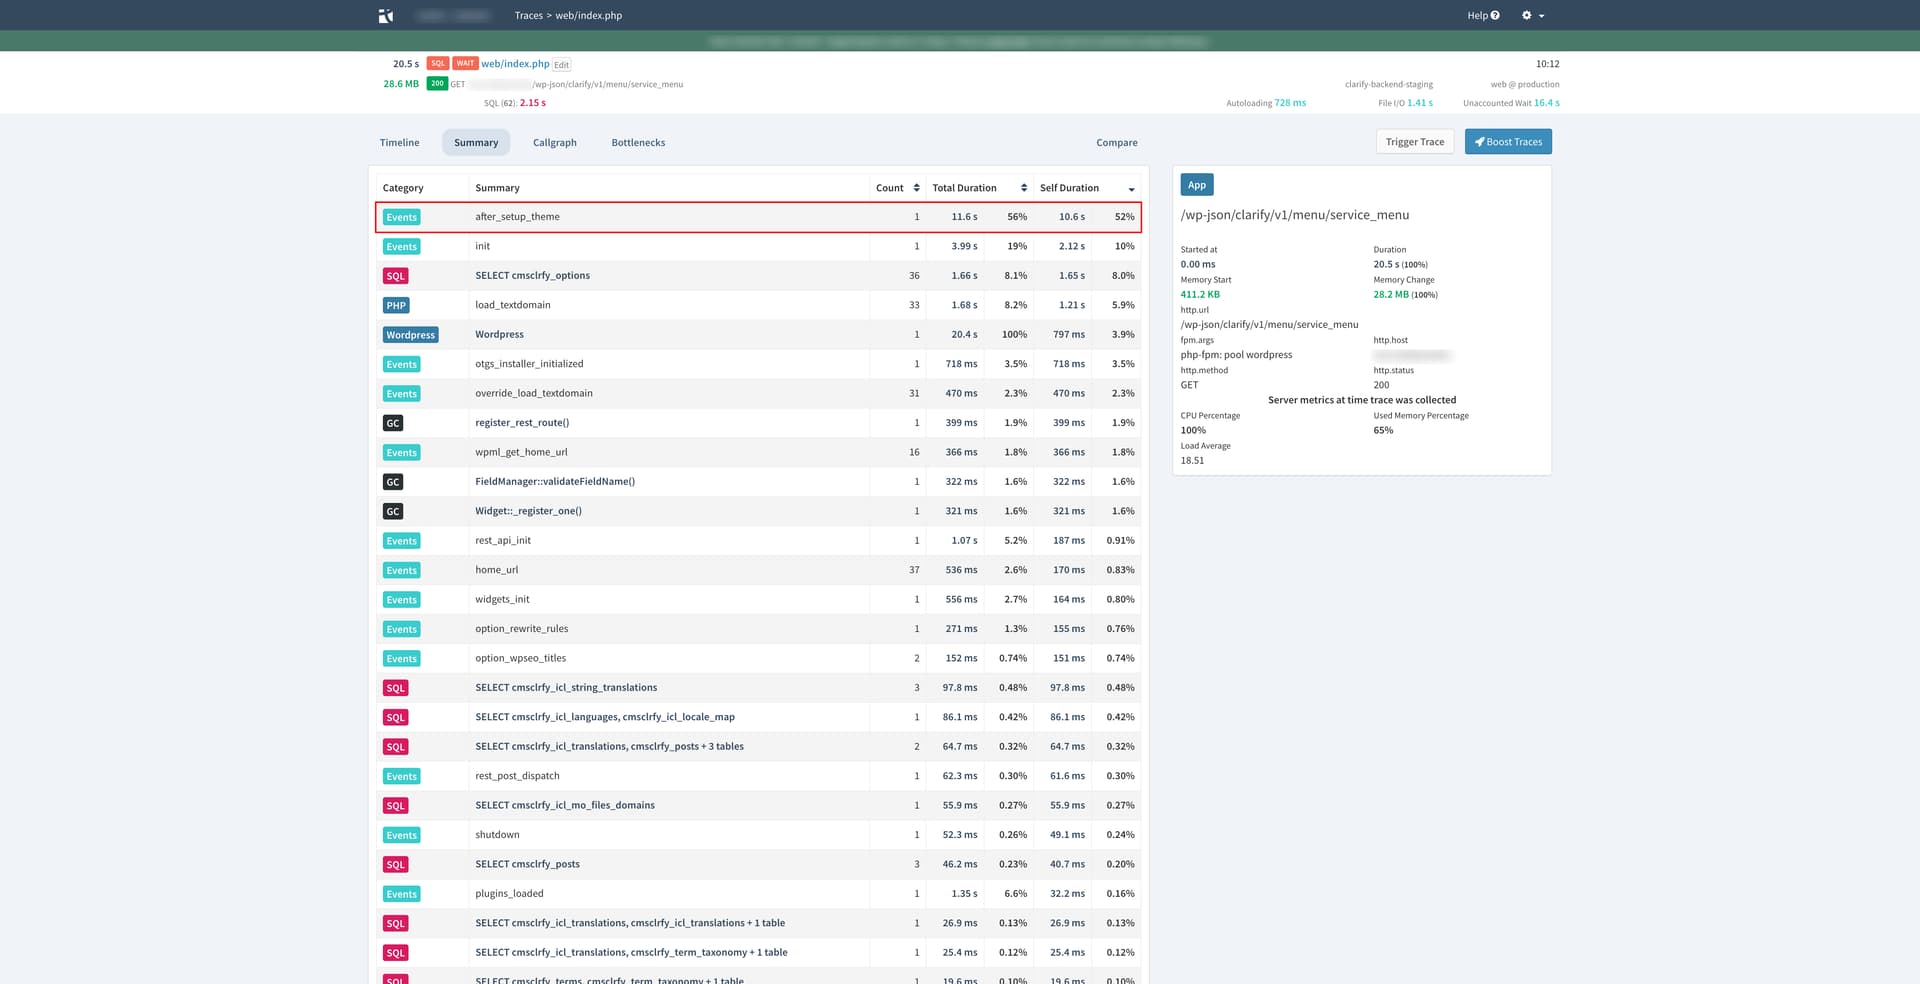
When I inspect one of the SQL WAIT web/index.php calls, the after_setup_theme event takes a staggering 11.6 s:
That’s a bit harder to debug for me, it’s not working with the Google Chrome extension nor with the GET-parameters if I use the decoupled domain. This only works calling the CMS endpoints directly, but since 1 front-end page, calls multiple CMS endpoints I have to find another way to enable these callgraphs for multiple API calls.