Try this -
Create a new project from existing files (Web server is installed locally, source files are located under its document root)
This is good.
As project root I pick the current roots theme I am developing /site_name/site/web/app/themes/site_nametheme
I believe most of your problem is here. Don’t set your theme as the root, set the topmost directory as root. PHP Storm needs to be able to map the local path to its corresponding path on the VM, so while I’m sure it’s possible to set the theme as the root, I’ve always set the server root as my project root.
So, in your example, the root should be /site_name/ Make sure it’s the full path as well. (Just use the little dots to open a dialog and navigate to your project root).


I just set up a test project to make sure, everything is working fine. Here’s my directory settings, and my project tree drawer thing.

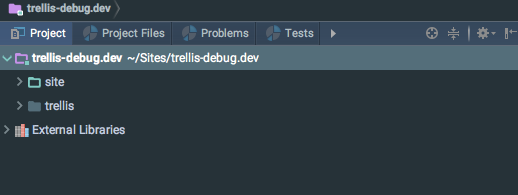
Specify local server (use existing server configured for the site http://site_name.dev)
Web path for project root is ‘/’
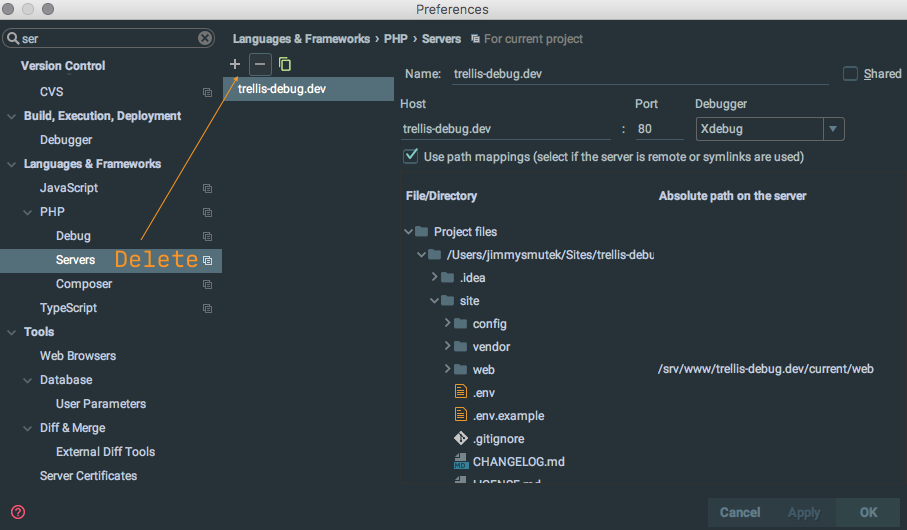
You don’t have to do any of this stuff anymore. Use PHP Storm’s “zero config debug”. First, go in to preferences/languages & frameworks/php/servers and delete any servers you’ve manually set up. I don’t know if debug configurations are still being used, but if you have any of those set up, delete them as well.
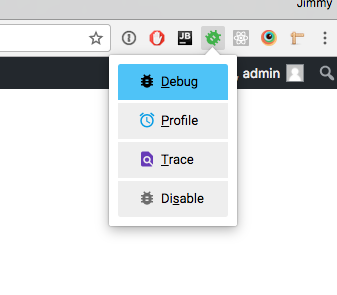
Install one of the Xdebug helper plugins, they are both linked in my post but here’s the Chrome plugin.
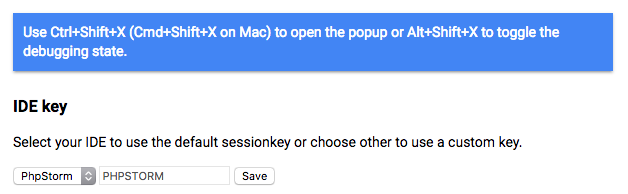
In the xDebug browser extension, set the IDE key to PHPSTORM…
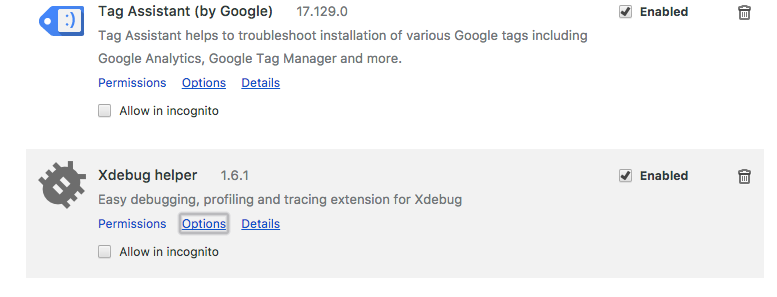
…then come back out to your browser and enable the extension.
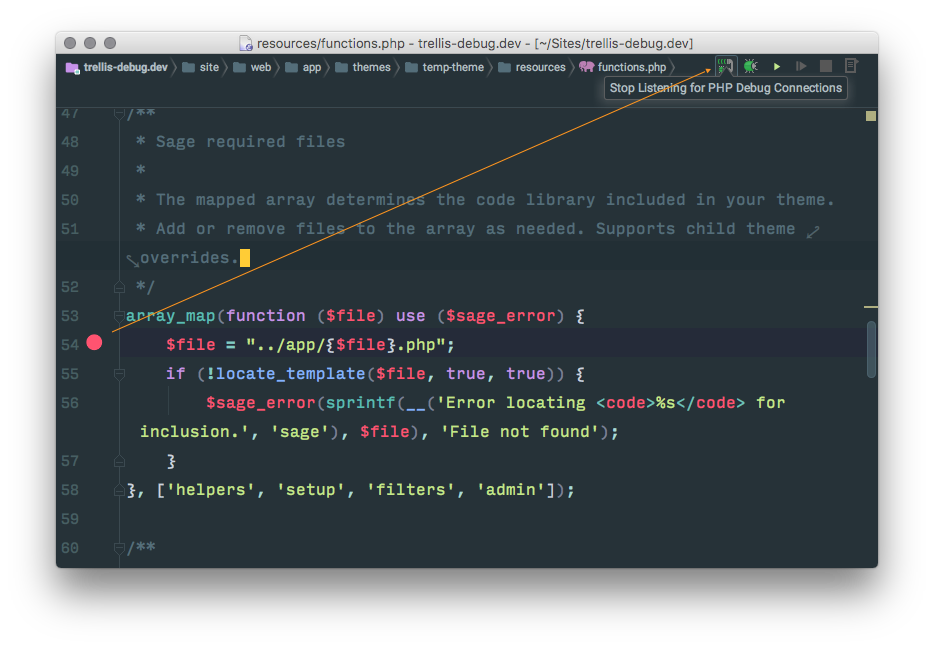
Set a breakpoint in your code somewhere and click the little phone to tell PHP Storm to listen for incoming connections. I set one on the required files function in resources/functions.php because I’m testing, and I know that function runs on every page load. Also, I haven’t been able to get the debugger to work in blade files. I haven’t tried recently, so maybe that has changed.
Anyway, switch back to your browser, refresh the page, and if you did everything correctly you should immediately see this dialog -
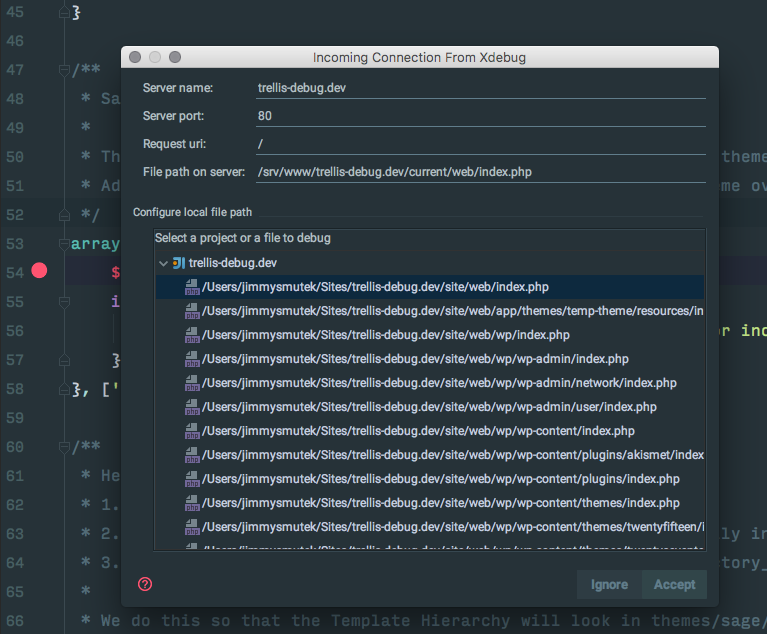
Just click accept and you’ll be de-buggin’.
Hope this was helpful.